
Are severe convective storms becoming more common? WTW-sponsored research picks out those U.S. regions where tornado outbreaks have trended upwards in recent decades.
Severe convective storms (SCS) made a sizable impact on the (re)insurance industry in 2023. This category of peril, which includes straight-line winds, hail, and tornadoes, caused more than $50 billion in claims for the U.S. alone and accounted for more than half of all global insured losses 1. During the past few decades, SCS-related losses have steadily increased largely due to exposure growth. But how have the frequency and severity of SCS themselves changed during that period? Until now, has been difficult to answer these questions because of the intrinsic nature of SCS hazards and the way we have recorded their occurrence. But new research from our group at Columbia University has leveraged what we know about broad-scale atmospheric conditions to uncover previously unknown trends in one of the most important kinds of SCS hazards: tornado 'outbreaks'.
The limitations of storm reports
Whenever we try to detect reliable climate signals, scientists first need a dense network of observations that spans many decades. Currently, the best set of tornado, hail, and damaging wind observations come from the National Oceanic and Atmospheric Administration's Storm Prediction Center reports. Although these reports should be taken seriously as observed events, they cannot be taken literally as perfect accounts of storm risk.
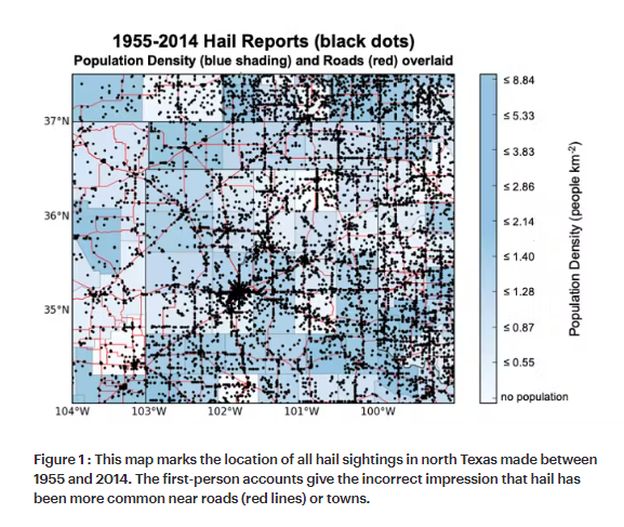
Severe weather events are reported where and when people encounter them. Therefore, we can expect to see more reports in certain locations simply because that location is densely populated. For example, if we map all first-person reports of hail across north Texas (Figure 1), we see that hail appears (incorrectly) to be most common near towns and cities, interstates, and state highways. In addition, there are generally more reports in recent years simply because technologies (such as Doppler radar) and reporting practices have improved through time. How do we account for these "artificial" or unphysical influences that have nothing to do with the real behavior of severe storms?
Another challenge is that tornadoes are rare and sporadic events. Even though first-person reports go back several decades, that interval is still not long enough to overcome for the inherent randomness ("stochasticity") of weather. During the period for which we have records, one town may have never experienced a tornado whereas the adjacent town may have experienced several tornadoes. Despite their different histories, we should not conclude that their exposure to the peril has been (and will be) substantially different. The more likely explanation is that one town has been luckier than the other over the relatively short period since records began.
Scientists can overcome this 'sampling bias' by spatially smoothing the reports to account for the uncertainty in the exact event location2,3 This is a reasonable approach, but the outcome can be influenced by our choice of statistical parameters. Fortunately, we can also apply another independent approach that is less reliant on first-hand reports and can serve as another line of evidence for evaluating variability and trends in SCS activity: analysing the large-scale environmental conditions that give rise to tornado outbreaks.
Using large-scale environments to model severe storm activity
As a supplement to the (smoothed) report data, many scientists have chosen to model SCS activity based on the large-scale environment, in this case, the state of the atmosphere over distances of hundreds of kilometers4,5, with known physical links to SCS hazards. In earlier research, SCS modeling via large-scale environments has been useful for explaining how the El Niño-Southern Oscillation affects the frequency of hailstorms and tornados6.
In our research group at Columbia University's Department of Applied Physics and Applied Mathematics, we study how the Earth's climate determines the behavior of severe weather now and in the future. With support from the WTW Research Network, we have adopted a new approach to uncover subtle trends in tornado outbreaks across the United States. Tornado outbreaks – when many tornadoes occur over one or two days – represent one of the most extreme hazards from SCS and can cause major loss of life and property. In a study published recently by the Monthly Weather Review 7, we constructed a new tornado risk index to calculate the probability of an outbreak based on three key environmental factors:
- convective precipitation, which measures the strength of rising motion (or convection);
- storm relative helicity, which represents the potential for rotation within the rising motion; and
- convective available potential energy, which describes the atmospheric instability and is a proxy for the "fuel" available for a developing storm.
We found that our environment-based index performed well overall and matched the large-scale patterns in the observed reports, which made us more confident that both datasets lead to the same overall conclusion.
Identifying regional hotspots in tornado outbreak trends
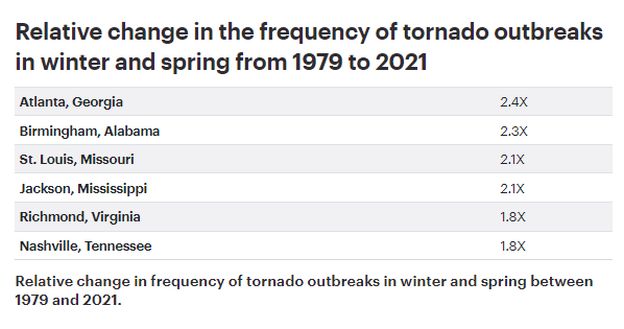
Our two main lines of evidence agreed that, over the past four decades, tornado outbreaks have become two to three times more common over much of the southeastern United States during winter and spring (Figure 2). On these maps, the red shading identifies those places where the frequency of outbreaks has increased over the past four decades. For example, a mapped value of two means the frequency of outbreaks today is double the rate for the same location averaged over the entire period.
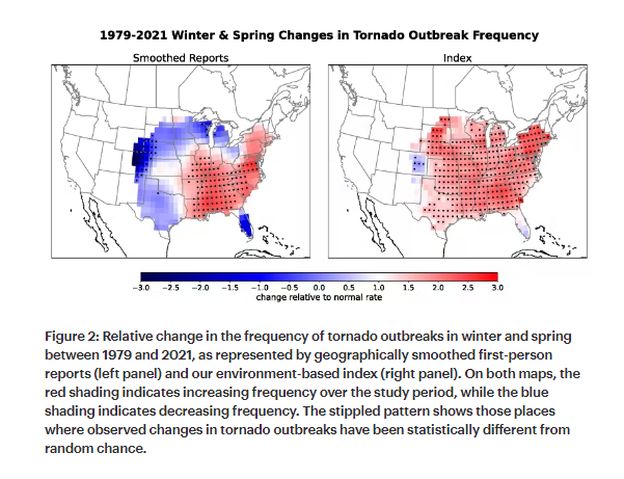
When we repeated the same analysis for outbreaks in summer and autumn, we did not detect strong trends in any part of the continental United States. But for the winter and spring seasons, we found the smoothed reports (left panel) and the environment-based index (right panel) both indicate that the frequency of tornado outbreaks has increased the most over the lower Mississippi River basin, an area that includes Louisiana, Arkansas, Missouri, southern Illinois, southern Indiana, Kentucky, Tennessee, Georgia, Alabama, and Mississippi. This geographic pattern is matched by upward trends in all three of the "ingredients" of our index (convective precipitation, storm relative helicity, and convective available potential energy) over the same area.
Farther west, along the center axis of 'Tornado Alley', the picture is not so clear. Our environment-based index indicates that the risk of tornado outbreaks has increased along a north-south corridor from Texas to South Dakota, mirroring the same trend seen across the southeastern US. But although the environment backdrop for outbreak development has become more favorable, that trend has not been matched by on-the-ground reports. In Texas, although the trend is largely non-significant, outbreaks have actually been somewhat less common lately than they were three or four decades ago. Time will tell if the upward trend in environmental variables provides advance warning of more frequent tornado outbreaks for the part of the US.
We don't know how much of upward trends in tornado outbreaks is due to human-caused global warming, or how future warming will affect SCS activity in the U.S. or elsewhere. But, for the first time, we can identify parts of the country where the frequency of tornado outbreaks has already changed relative to the previous few decades. According to FEMA, 8much of the southeastern United States already faces 'relatively high' or 'very high' risks from tornadoes. People living and working in this part of the country might be well served to reevaluate their exposure to tornado damage and prepare accordingly.
Tornado solutions from WTW's Climate Practice
The research outlined here provides clear evidence of the broadscale evolution in the probability of tornado outbreaks across the United States over the past 40 years.
Risk management decisions based on outmoded analytics that fail to account for these trends could cause organizations to breach tolerable levels for exposure to tornado risk.
By leveraging the latest scientific evidence in our risk models and risk consulting, clients of WTW's Climate Practice benefit from advanced, quantitative insight able to underpin a smarter, forward-looking approach to managing tornado risk – both to their own facilities and across the value chain.
Starting with an initial assessment of tornado exposure using Global Peril Diagnostic, WTW's cross-disciplinary solutions - spanning risk engineering, climate science, and Enterprise Risk Management – are designed to provide clients the insight necessary to inform risk management decisions that enhance their resilience amidst climate uncertainty.
Footnotes
1. WTW (2024), Natural Catastrophe Review July - December 2023.
2. Brooks, H. E., Lee, J. W., & Craven, J. P. (2003). The spatial distribution of severe thunderstorm and tornado environments from global reanalysis data. Atmospheric Research 67, 73-94.
3. Tippett, M. K., Sobel, A. H., & Camargo, S. J. (2012). Association of U.S. tornado occurrence with monthly environmental parameters. Geophysical Research Letters, 39.
4. Allen, J. T., Tippett, M. K., & Sobel, A. H. (2015). Influence of the El Niño/Southern Oscillation on tornado and hail frequency in the United States. Nature Geoscience 8, 278-283.
5. Cook, A. R., & Schaefer, J. T. (2008). The relation of El Niño–Southern Oscillation (ENSO) to winter tornado outbreaks. Monthly Weather Review 136, 3121-3137.
6. Tippett, M. K., & Lepore, C. (2021). ENSO‐based predictability of a regional severe thunderstorm index. Geophysical Research Letters 48, e2021GL094907.
8. FEMA (2024), National Risk Index,
The content of this article is intended to provide a general guide to the subject matter. Specialist advice should be sought about your specific circumstances.