
Over the past few years, the asbestos litigation environment has undergone many changes, including legislative and judicial tort reform, judicial investigations into the quality of supporting medical evidence, and a heightened scrutiny of the documentation accepted by several larger asbestos trusts. To analyze recent trends in filings and settlements in light of these structural changes, we compiled data on asbestos-related claims during the period 2001 through 2008 for over 150 solvent defendants who report claims in their public filings.1 The observations reported below are based on public data and may differ for an individual defendant.
More specifically, we analyze key metrics frequently used to assess a company's asbestos-related liabilities. These include annual filings (the number of new claims a company receives each year), total indemnity paid (the aggregate amount a company pays to resolve claims each year), the number of claims resolved (how many claims a company closes each year either by settling or dismissing), the percent of claims dismissed (the fraction of claims a company closes without payment), and the average settlement paid per claim (the total indemnity paid divided by the number of claims closed each year). These elements will drive projections of future indemnity payments.
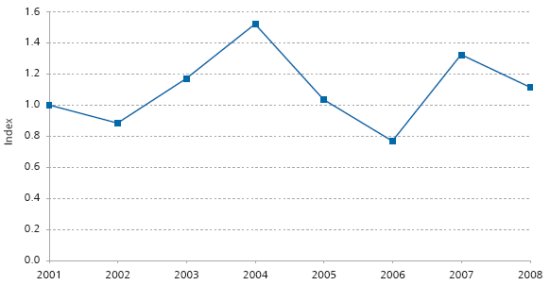
Average Claim Filings Have Declined 84% Since 2003
- Average claim filings peaked in 2003 and have dropped in subsequent years.
- From its peak in 2003 through 2008, the average number of claims filed has fallen 84%.
Figure 1. Average Number of Asbestos Claim Filings Indexed to 2001
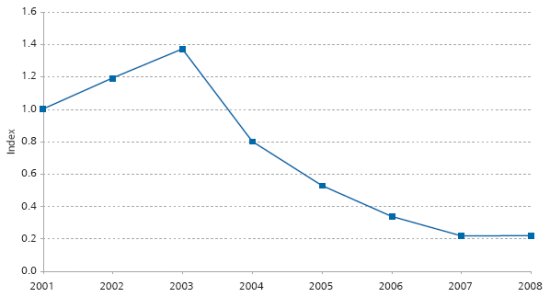
- The period over which claim filings dropped corresponds to the enactment of legislative and judicial tort reforms in multiple jurisdictions.
- These reforms include medical reforms, which barred unimpaired claims or relegated them to deferred dockets (e.g., in New York, Ohio, Texas, Georgia, and Florida) and venue reforms, which barred out-of-state claims, with out-of-state exposure (e.g., in Mississippi and West Virginia).
- In 2005, a US District Court challenged the diagnoses of doctors frequently used by plaintiffs' attorneys to support a non-malignant disease claim. Several asbestos trusts responded by no longer accepting documentation from these same doctors.
- Although most companies included in this report did not report malignant versus non-malignant filings in their 10-Ks, given that the reforms primarily targeted unimpaired non-malignant claims, the drop in total filings likely represents a drop in non-malignant filings. In fact, this shift in filings was recorded by the one company that did report new claim filings by disease.
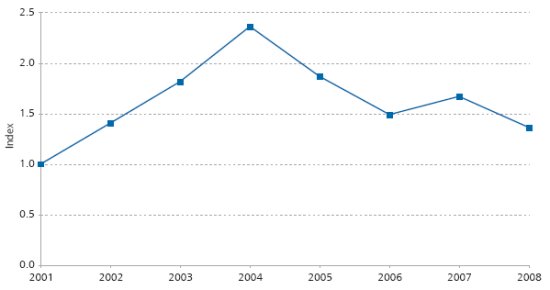
Indemnity Payments, After Rising Sharply From 2001 Through 2004, Have Fallen Back To 2002 Levels
- On average, the total indemnity payments by defendants increased approximately 33% each year from 2001 through 2004.
- Indemnity payments began to decline, on average, in 2005 and by 2008, the increase was almost completely reversed, with total payments dropping back to 2002 levels.
Figure 2. Defendant Average Asbestos Indemnity Payments Indexed to 2001
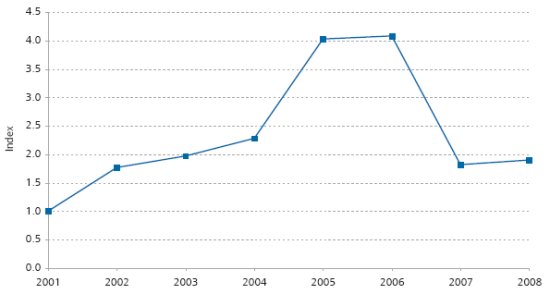
Total Number Of Resolved Claims Has Dropped In Recent Years
- One explanation for the recent drop in total indemnity payments is a reduction in the number of claims resolved (either settled or dismissed) by defendants.
- After a peak in resolutions in 2005 and 2006, the average number of resolutions has fallen, with a particularly steep decline occurring in 2007.
- The recent drop in resolutions is consistent with the creation of deferred dockets in a number of jurisdictions, which halts the litigation process for claims unable to demonstrate impairment.
- Given the typical lag between filing and resolution dates, the drop may also reflect the slower pace of claim filings, which began in 2004, but may only recently have affected the number of claims resolved.
Figure 3. Average Number of Resolved Asbestos Claims Indexed to 2001
As Filings Have Dropped, Dismissal Rates Have Risen
- Dismissal rates have been increasing since 2001; average dismissal rates were almost three times higher in 2008 than in 2001.
- The biggest recent increase in dismissal rates occurred in 2004, the same year in which claim filings began to decline, although 2008 saw another big increase.
Figure 4. Average Asbestos Dismissal Rates Indexed to 2001
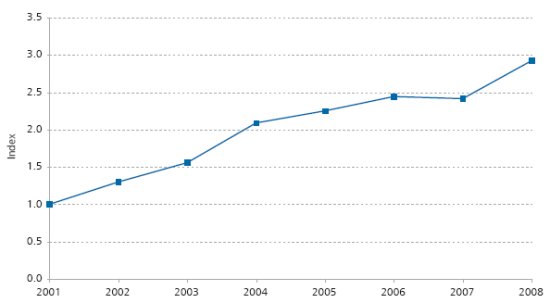
- The increase in dismissal rates may also be linked to the recent tort reforms, in which some previously filed cases have lost some or all of their value, either being relegated to a deferred docket or denied standing.
- Again, because the reforms targeted unimpaired non-malignant claims, it is likely that the increase in the dismissed claims represents the dismissal of unimpaired non-malignant filings.
Average Dollars Paid Per Resolved Claim Have Been Quite Variable—Fluctuating As Much As 40% Per Year—Likely As A Result Of A Changing Disease Mix
- Average dollars paid per resolved claim (including both settled and dismissed claims) have exhibited a sawtooth pattern since 2001, with annual changes either up or down of 20–40%.
- The variability has occurred both overall and at the company level. Average dollars paid per resolved claim dropped in 2005 and 2006 (with over 65% of the component companies reporting lower average dollars in 2006 than in 2004), rose in 2007 (with over 70% of component companies reporting higher average dollars), and then fell again in 2008.
- Current average dollars paid per resolved claim remain below the peak in 2004, but above the levels in 2005 and 2006.
Figure 5. Average Dollars per Resolved Asbestos Claim Indexed to 2001
- The increase, on average, in dollars paid per resolved claim does not indicate an increasing average for any disease, however. Instead, it is consistent with the joint hypothesis that i) the higher dismissal rates have come from an increase in dismissals of non-malignant claims, and ii) the decline in the number of resolved claims reflects a drop in non-malignant resolutions.
- If this hypothesis is true, even if resolution rates and average settlement dollars for malignant claims have remained constant, we would expect to observe an increase in the overall average dollars paid per resolved claim (i.e., the average payment across all diseases).
Summary Of Trends Through 2008: Aggregate Results Are Generally Favorable To Defendants
- Filings are down; dismissal rates are up; and total indemnity payments are down—all favorable trends for defendants.
- One seemingly unfavorable trend for defendants has been the increase in average dollars per resolved claim, although even these averages pulled back slightly in 2008. However, this trend is likely the result of a changing disease mix.
-
- More specifically, these trends of decreased filings, increased dismissal rates, and higher average settlement values likely reflect the effect of tort reforms, which have reduced the number and value of unimpaired non-malignant claims, leaving the resulting disease mix skewed more heavily toward malignant diseases.
- While only a few companies reported disease-specific information concerning their claims, for those companies, malignant claims represent a greater mix of claims filed or pending in the past two years than in prior years, consistent with this hypothesis.
- The changing disease mix, with an emphasis on malignant claims, is consistent with results obtained in NERA's analysis of non-public claims data. We have observed, for example, that for some defendants i) plaintiffs' attorneys have been filing fewer non-malignant claims, with an increased focus on malignant claims, and ii) defendants have begun settling cases, primarily those involving cancers such as mesothelioma and lung cancer. While these defendants are paying more on average per claim (with a shift toward the resolution of malignant filings), they have also received and settled fewer claims than historically, so that overall expenditures are down.
Footnotes
* Lucy P. Allen is a Senior Vice President and Mary Elizabeth C. Stern is a Vice President with NERA Economic Consulting. The authors thank Adelina Halim and Simona Heumann for their valuable contributions to the paper.
1. Data from the most recent Form 10-K were used whenever available. We included only data reported at the individual claim level and for companies reporting at least two consecutive years in the period. The index is an average of trends observed at the company level. The indices reported in the charts below may contain different companies, depending on which companies reported each statistic.
The content of this article is intended to provide a general guide to the subject matter. Specialist advice should be sought about your specific circumstances.