
Exhausted from navigating through an Excel model to discern the credit card inflow breakdown for Q2? Advanced data visualization tools like Tableau, Microsoft Power BI, and QlikView, along with coding languages such as R and Python, can significantly refine and elevate your financial analysis capabilities.
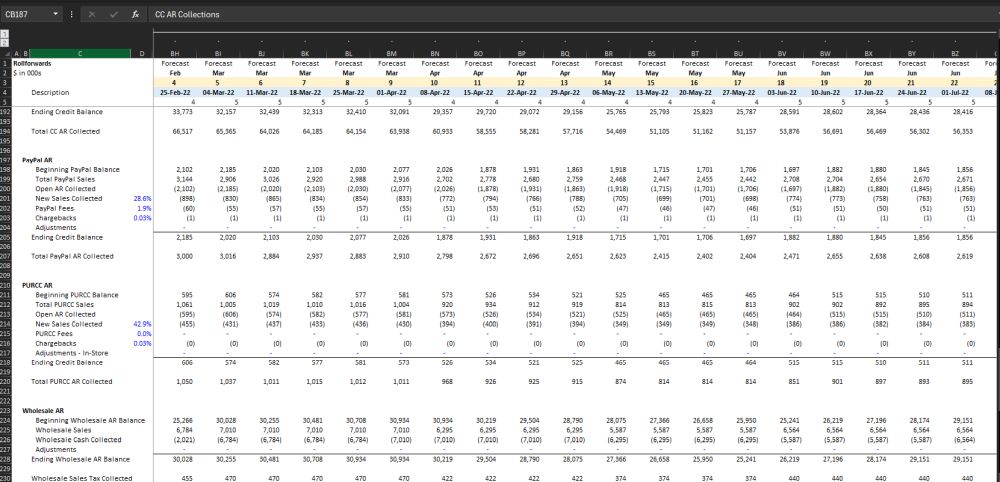
From flipping through Excel tabs...
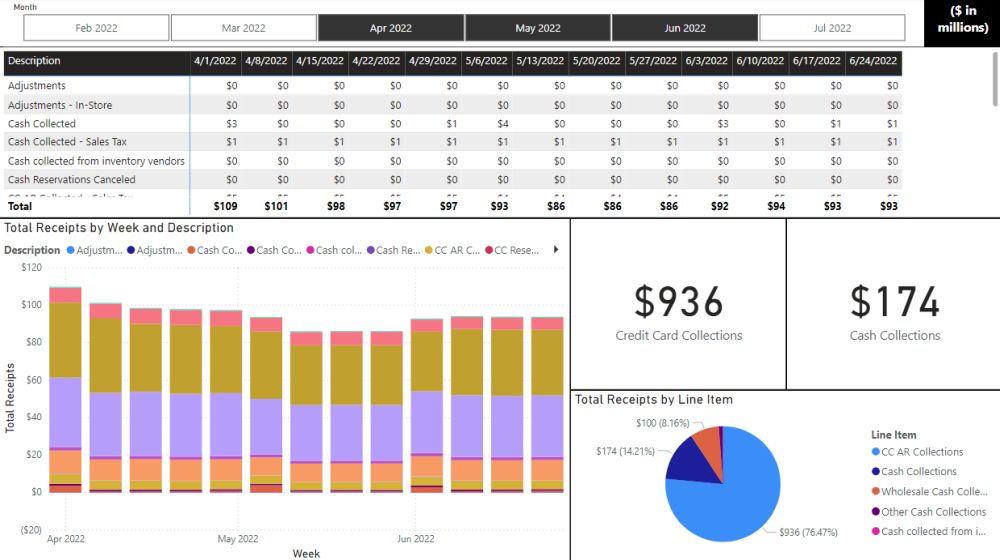
...to immediately identifying red flags and trends in a dashboard...
In the dynamic world of financial modeling and forecasting, the balance between traditional tools and modern solutions is key to achieving comprehensive and dynamic outcomes. Microsoft Excel and other spreadsheet tools have long been the cornerstone of financial analysis, offering robust capabilities for creating detailed models. However, the addition of complementary data visualization tools, such as Microsoft Power BI, has marked a significant evolution in how we approach financial planning, particularly in the realms of 13-week cash modeling and long-range planning (LRP).
Without sacrificing the form of your model, you can add a translation to the language of your data visualization tool to seamlessly dig in with more detail. As an added benefit, this can also be a stepping stone to preparing your data for AI.
Benefits
Data Visualization: Enhance financial models with dynamic views and in-depth analysis capabilities while maintaining a spreadsheet's depth and flexibility. Streamline the presentation of complex financial forecasts, making them more intuitive and accessible and enabling more confident decision-making.
Speed to Insight: Cut down the time needed to turn data into actionable insights. Real-time data processing and analytics allow for swift identification of trends and opportunities, facilitating quicker, informed decisions in a fast-paced environment.
Exploring the Depth & Breadth of Data: Easily move from a broad overview to detailed data analysis, providing a comprehensive view of financial data and helping to identify underlying trends and variances for more accurate financial planning and forecasting.
For corporate finance professionals and private equity sponsors, understanding the relationship between these tools is crucial; the detailed modeling capabilities of Excel are not only preserved but also elevated with advanced visualization and interactive features. It represents a balanced approach to financial forecasting and planning, where tradition and innovation work together to drive strategic decision-making.
We invite those interested in exploring how data visualization can enhance your spreadsheet models to reach out. Let us discuss how this powerful combination can transform your financial analysis and planning processes, empowering you to achieve greater insights and outcomes.
The content of this article is intended to provide a general guide to the subject matter. Specialist advice should be sought about your specific circumstances.