

- within Litigation, Mediation & Arbitration, Real Estate and Construction, Food, Drugs, Healthcare and Life Sciences topic(s)
- in European Union
Originally published July 2008
Please click on the following link to view 2008 Trends: Subprime And Auction-Rate Cases Continue To Drive Filings, And Large Settlements Keep Averages High in its entirety, inclusive of all charts, footnotes and glossary of terms.
If activity continues at this pace, there will be almost 280 filings in 2008, the highest level since 2002.
Introduction
After a decrease in 2006, filings began to increase in 2007. This trend has continued into 2008: currently, filings are on pace to reach almost 280 for the year, a level not attained since 2002.
What's driven the increase in filings? Clearly, the current subprime and credit crisis is a major factor in the recent surge in shareholder class action filings. In 2008, 51% of filings through June 30 have allegations related to the subprime collapse.
To test another potential driver of filings, NERA analyzed the impact of market volatility on longer-term patterns of class action filings. We find that high market volatility is positively correlated with the number of filings: if market volatility is higher during a quarter, controlling for market returns, filings are likely to be higher in that same quarter.
We have also examined the likelihood of a company facing a class action filing following a large drop in the company's stock price during the period from 2005 through 2007, as measured by a net-of-market one-day price decline of 20% or more.2 We find that the probability of a filing over the three months following such price drops increases with the size of the drop.
Even as filings were increasing in 2007 and 2008, average settlement values remained around $30 million. Removing settlements over $1 billion from the calculation, the 2008 average settlement actually fell to $10 million, well below the level of recent prior years, and much closer to the 2008 median of $6 million.
Although it is too early to know whether recently filed cases will result in big settlements, there is reason to expect that they will. Investor losses—a powerful determinant of settlement size—for cases filed in the first six months of 2008 have a median value in excess of $800 million, substantially higher than the approximately $350 million median for cases settled in the 2005-2007 time frame. The sharply higher investor losses of recent cases are largely a subprime phenomenon: median investor losses so far this year are more than 10 times as large in subprime cases as in non-subprime cases.
Filings
Recent Trends
After dipping sharply to a more than 10-year low of 131 filings in 2006, federal shareholder class action filings began to increase in 2007. By year-end, there were a total of 195 filings, surpassing the 2005 level. Through June 30, there have already been 139 filings in 2008. If activity continues at this pace, there will be almost 280 filings in 2008, the highest level since 2002.
Six-month data reveals more about the timing of the collapse and subsequent upsurge in filings. Filings fell precipitously in the second half of 2005, but this drop is masked in the annual data by the relatively high filings in the first half of that year.
Filings grew most strongly in the second half of 2007. This increase coincided with the first subprime-related filings: there were only nine subprime filings in the first half of 2007, but more than three times as many in the second half.3 The first half of 2008 brought another 49 subprimerelated shareholder class action filings, plus 22 other cases related to auction-rate securities market failures.4 Although the majority of options backdating cases were filed in 2006, a handful of these contributed to the 2007 and 2008 upswing.
Figure 1. Federal Filings
January 1, 1996 - June 30, 2008
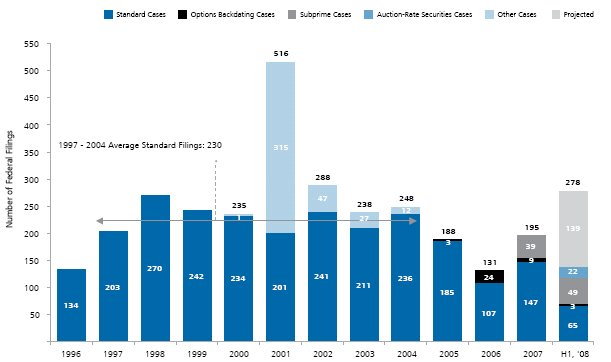
Figure 2. Federal Filings: Six-Month Intervals
January 1, 2002 - June 30, 2008
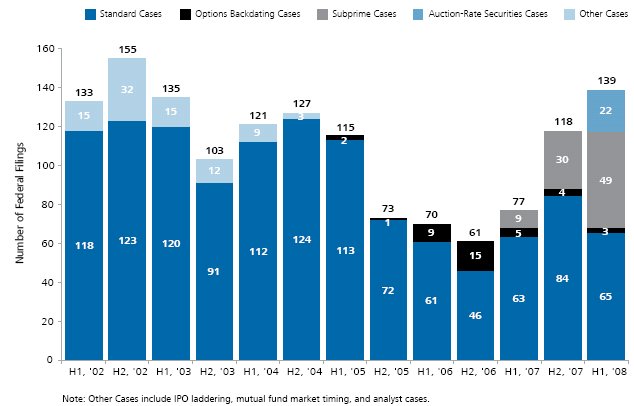
Figure 3. Federal Filings by Circuit, Year, and Type
of Case
January 1, 2006 - June 30, 2008
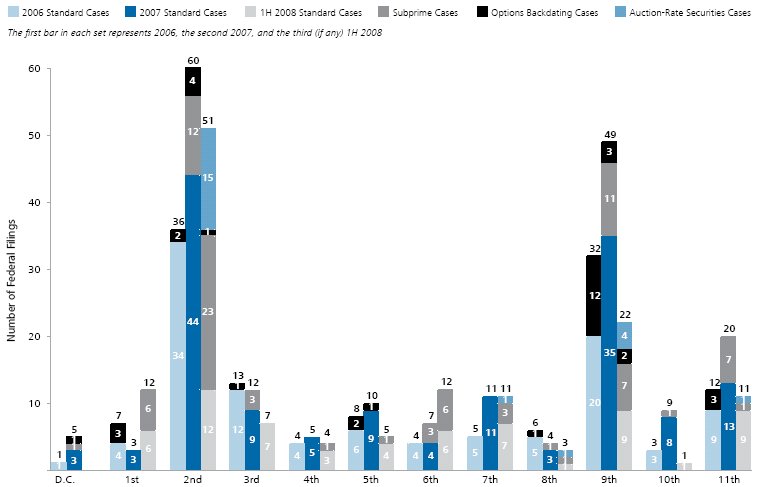
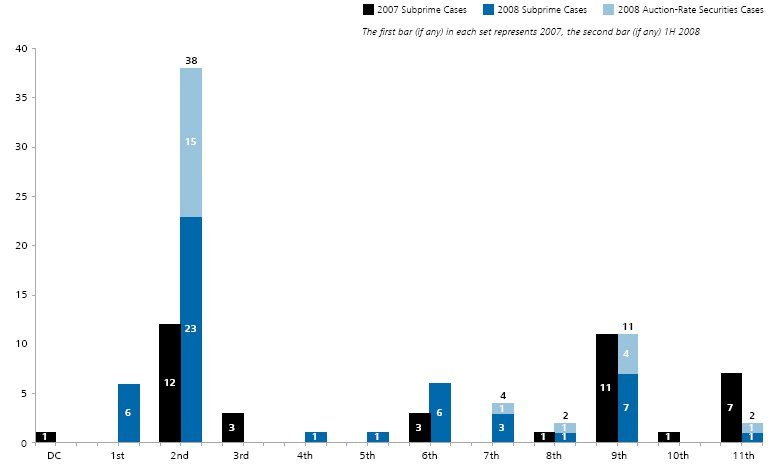
Figure 4. Federal Subprime and Auction-Rate
Securities Filings by Circuit
January 1, 2007 - June 30, 2008
Notably, subprime and auction-rate securities cases alone cannot explain the increase in filings. Since June 2007, standard filings—which exclude auction-rate securities, subprime-related, and options backdating cases—have exceeded the levels of 2006 and the first half of 2007.
Historically, securities class action filings have been concentrated in the Second Circuit (including Connecticut, New York, and Vermont) and the Ninth Circuit (which includes California and certain other Western states and territories). This remains the case in 2008. Year-to-date, the Second Circuit has seen more than twice as many filings as the Ninth, due in large part to subprime and auctionrate cases; the financial institutions that these cases target are concentrated in New York. For standard filings, on the other hand, the Second Circuit is ahead of the Ninth by only 30%.
The concentration of issuers in the Second Circuit is particularly great in auction-rate securities cases, which first appeared in 2008. While seven of these cases are to be found among the Seventh, the Eighth, the Ninth, and the 11th Circuits, the other 15 are all in the Second.
While subprime and credit crisis-related filings are primarily a Second and Ninth Circuit phenomenon, all Circuits have had at least one such case. In 2007, seven subprime filings were filed in the 11th Circuit—which includes Florida, a state associated with some of the earliest subprime-related disclosures—but the 11th Circuit has had only one case filed in the first six months of 2008.
What drives filings?
The recent surge in filings is clearly linked to the credit crisis, and, in particular, to the subprime meltdown and auction-rate securities market failures. This crisis alone, however, cannot explain the fact, noted above, that standard filings have increased from their depressed 2006 level. To understand that trend, we consider more general factors that might affect the rate of filings.
Broad Market Performance
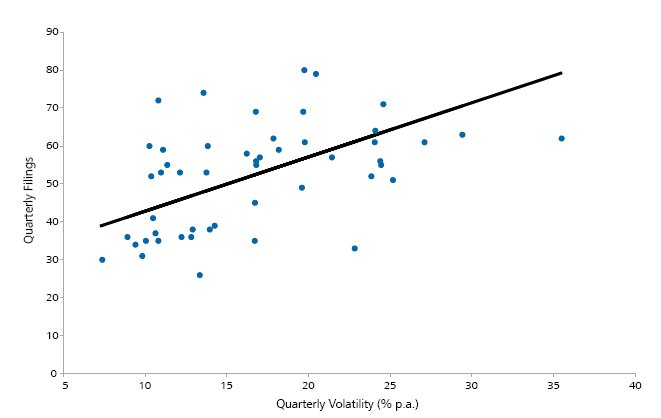
We analyzed the quarterly relationship between market volatility and the number of federal shareholder class action filings. This relationship is depicted in Figure 5, where market volatility is measured as the annualized standard deviation of daily returns to the S&P 500 Index.5 We find a statistically significant positive correlation between quarterly market volatility and filings.
The positive and statistically significant relationship between volatility and filings holds when we control for returns to the S&P 500. However, as can be seen from the plot in Figure 5, the relationship between volatility and filings is not tight.6 While filings seem to move with market volatility, controlling for market returns, the two variables together explain only approximately 30% of the variation in quarterly filings.
Figure 5. Quarterly Filings (Standard, Options
Backdating, and Subprime) vs. Volatility of the S&P 500
Index
1Q 1996 through 2Q 2008
Incidence of Large Price Drops in Individual Stocks
Another variable that might help to explain volatility in filings is the number of large price drops in individual stocks. These large drops—rather than the rate at which the broad market moves up and down—may trigger shareholder class action litigation because they often follow disclosures of adverse company-specific news that fuel allegations of fraud.
To test whether filings are related to large stock-specific price declines, we collected data on daily prices and returns for all companies with market capitalization of at least $100 million that traded on either the NYSE or NASDAQ within the period from 2005 through 2007.7 From these data, we calculated the number of "large" daily price declines, defined as one-day net-of-market drops of 20% or more in an individual company's stock.8 We merged these data with our historical filings data.9 From the matched data, we identified filings that occurred within the three months following a large price decline.
We find that the probability of a suit rises with the size of a large price decline: whereas only 9% of drops of 20-30% are followed by a shareholder class action federal filing within three months, almost 31% of drops of 40% or more are followed by a filing within that time frame. See Figure 6.
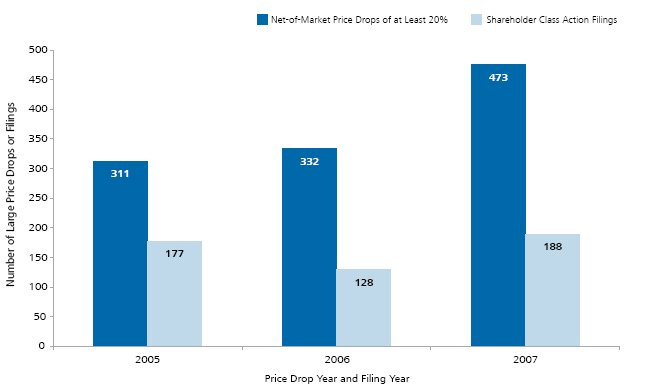
We examined the relationship between large price drops and same-year filings over the period 2005 through 2007, and find that the relationship has not been stable in recent years. Specifically, in 2005, there were 311 large drops and 177 filings, for a rate of 0.57 filings per large drop. In 2006, there were slightly more large drops, 332, but substantially fewer filings, 128, only 0.39 filings per large drop. In 2007, the number of large drops rose to 473 and the number of filings to 188, making for 0.40 filings per large drop.10 See Figure 7.
Figure 6. Percent of Net-of-Market Price Drops
Followed by a Shareholder Class Action Filing Within Three
Months, By Size of Price Drop
January 1, 2005 - December 31, 2007
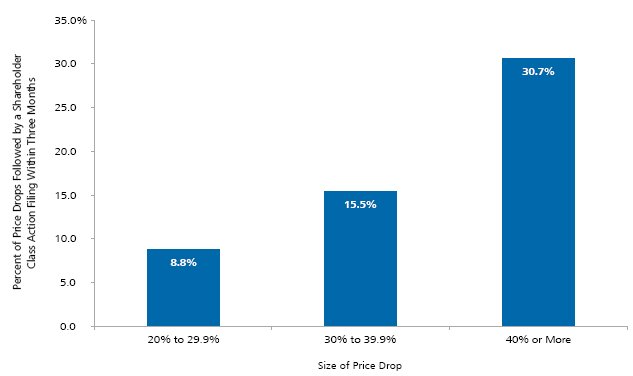
Figure 7. Large Net-of-Market Price Drops on NYSE
and NASDAQ and Total Federal Shareholder Class Action Filings
By Filing Year
January 1, 2005 - December 31, 2007
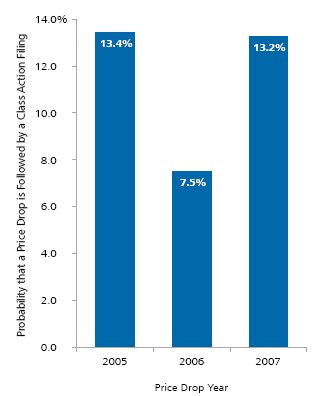
Viewed differently, the probability of a class action filing within three months following a large price drop has varied over time, falling from 13.4% in 2005 to 7.5% in 2006, then coming back up to 13.2% in 2007. See Figure 8.
This analysis helps to rule out one hypothesis for the lower number of filings observed in 2006: it was not the lack of large price drops in 2006 that led to the decline in filings. In fact, there were more net-of-market large price drops in 2006 than in 2005, creating potential opportunities for plaintiff firms to file cases. Despite this, the number of class action filings fell sharply in 2006.
Figure 8. Probability of a Shareholder Class Action
Filing Within Three Months of a Net-of-Market Price Drop of at
Least 20%
January 1, 2005 - December 31, 2007
Trends in Allegations
Class action cases filed in recent years contain a wide variety of allegations. Figures 9 and 10 group these allegations into seven major categories.
Over the three years from 2005 through 2007, nearly 30% of allegations were related to accounting—i.e., they claimed that defendants had violated Generally Accepted Accounting Principles (GAAP)—and another 25% related to company-specific earnings guidance.11
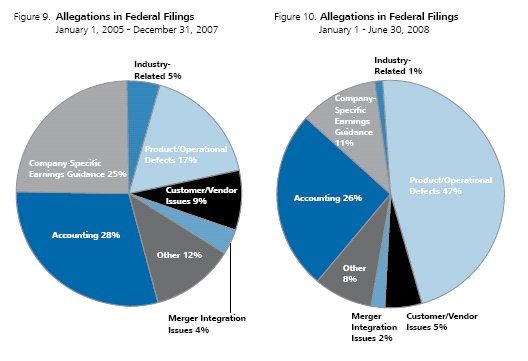
This year has seen a shift in the pattern of allegations, with 47% (up from 17%) now related to product or operational defects. Many of 2008's product and operational defect allegations are raised in the subprime crisis cases, which often allege that financial products related to mortgage securities or credit markets failed to function as advertised.12 Specifically, the products are often alleged to have been riskier than originally represented.
Allegations relating to company-specific earnings guidance fell most in relative importance as product and operational defect allegations rose. Accounting allegations drop substantially each year from 2005 through 2007, but in 2008 they are running at a higher rate than in any of those years, due in part to their prominence in subprime cases. If accounting allegations continue to be included in complaints at this same rate in the second half of 2008, a total of 104 cases will contain accounting allegations for the year.
Figure 11. Number of Accounting Allegations in
Subprime and Non-Subprime Federal Filings
January 1, 2005 - June 30, 2008
Resolutions
In addition to tracking trends in filings, NERA collects information about how shareholder class action cases are resolved. Of all post-PSLRA filings in our database that have been resolved, approximately 40.4% have been dismissed, and 59.5% have settled with all defendants, with only a very tiny fraction having reached a verdict at trial.13
For cases filed between July 1, 2001 and June 30, 2006, dismissals account for 43.8% of dispositions. The somewhat higher dismissal rate of this sub-group is not strictly comparable to the 40% rate of the group as a whole, however, as it may include dismissals without prejudice that will be reversed by amended and betterpled complaints, dismissals with prejudice that will be successfully appealed, and possibly even dismissals without prejudice that will nonetheless settle.
Because cases may require more or less time to resolve, and because the probability of dismissal may vary at different stages of a case's life cycle, we examine resolution statistics in more detail in two alternative ways below.
Resolutions of Cases Filed in 2000
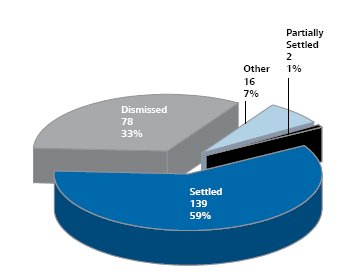
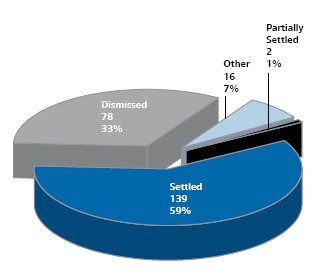
Recognizing that it may take several years for cases to be resolved, we analyze the resolutions of cases filed in 2000. Because this filings cohort has had a fairly long period to resolve, when we look over this longer horizon it provides a more complete picture of the final resolutions.
Of the 235 cases filed in 2000, over 60% have settled or have partially settled (i.e., at least one of the defendants in the case has settled). Another 33% have been (and remain) dismissed. Only about 7%, or 16, have not yet been resolved, and are either still pending or have been abandoned by plaintiffs.
For the resolved cases filed in 2000, the average time to resolution was 2.7 years; for dismissals the average was 1.8 years, and for settlements, it was 3.3 years.
Figure 12. Status of 235 Federal Shareholder Class Actions Filed in 2000
Two-Year Dismissal Rates
Another way to look at dismissal rates is to measure the percentage of filings that were dismissed within two years and remain so.14 Two-year rates have the advantage of allowing us to use data for cases filed as recently as the first half of 2006.
The two-year dismissal rate for cases filed since July 21, 2001 is 24%. This rate varies by Circuit, as shown in Figure 13, with the highest rates in the Fourth Circuit. The Second and Ninth Circuits—with the most filings—have similar dismissal rates of approximately 24%.15
We find that these two-year dismissal rates have been steady over time, without much change in overall or Circuit-specific patterns.
Trials
As shown above in Figure 12, over 90% of the cases filed in 2000 have been resolved, with the remaining 8% still pending. The vast majority of these cases were resolved with a settlement or dismissal before reaching trial. In fact, only four of the cases filed in 2000 have gone to trial. See Table 1 for details.
Footnotes
1 This edition of NERA's research on recent trends in shareholder class action litigation expands on previous work by our colleagues Lucy Allen, Elaine Buckberg, Frederick C. Dunbar, Todd Foster, Vinita M. Juneja, Denise Neumann Martin, Ronald I. Miller, and David I. Tabak. We gratefully acknowledge their contribution to previous editions as well as this current version. The authors also thank Jake George, Marcia Kramer Mayer, Robert Patton, and Carl Vogel for helpful comments on earlier drafts of the paper. In addition, we thank Stuart Neilson, Corina Onisoru, Nicole Roman, Kaitlin Simpson, Carlos Soto, Maria Tarasyuk, Steven D. Towler, Jordanka Visokomogilska, and many other NERA researchers for further assistance. These individuals receive credit only for improving this paper; all errors and omissions are ours.
2 For stocks traded on the NYSE and NASDAQ with market capitalization of $100 million or more.
3 We include in this group any shareholder class action that has allegations caused by or related to the subprime meltdown or credit crisis. For more details, see "Subprime Securities Litigation: Key Players, Rising Stakes, and Emerging Trends," by Dr. Faten Sabry, Anmol Sanha, and Sungi Lee, 3 July 2008. This NERA study may be found here: http://www.nera.com/image/PUB_SubprimeSeries_Part_III_0708.pdf.
4 See NERA working paper, "Auction-Rate Securities: Bidder's Remorse?" by Stephanie Lee. This NERA study may be found here: http://www. nera.com/publication.asp?p_ID=3474.
5 Specifically, volatility is measured using the standard deviation of daily S&P 500 returns in each quarter, annualized by multiplying by the square root of 252.
6 We regressed quarterly filings on quarterly S&P 500 returns and quarterly S&P 500 volatility over the period from the first quarter of 1996 through the second quarter of 2008. Both independent variables are statistically significant at the 1% level. The adjusted R-squared of this regression is 0.31. Note that in the quarterly count of filings for this analysis we included only standard, options backdating, and subprime cases.
7 Source for the price data is FactSet Research Systems, Inc. If a company moved from one of these exchanges to the OTC market or to another exchange, it is not included in this analysis.
8 In particular, we adjust individual stock price movements for market movements by subtracting the relevant marketplace return from the stock's return to generate a "net-of-market" return. The NASDAQ Composite Index is used to adjust the price movements of companies that are traded on NASDAQ, and the NYSE Composite Index is used to adjust the price movements for NYSE companies. We do not classify an otherwise eligible drop as "large" if it occurred on a dividend ex-date. For the purposes of applying the $100 million market capitalization minimum, we measure market capitalization immediately after the price drop.
9 We exclude from filings data cases pertaining to auction-rate securities, preferred stock, bonds, hedge funds, mutual funds, or assets that were not traded on the open market. Thirty-two percent of the filings in our sample were preceded by a net-of-market price drop of 20% or more.
10 Note that these counts of filings are limited to the case types included in this analysis (i.e., only cases pertaining to common stock) and thus are lower than annual counts in Figure 1.
11 Most shareholder class action complaints have multiple allegations. All allegations are included in this analysis, such that the total number of allegations exceeds the total number of filings.
12 Specifically, 42% of the 2008 product or operational defect allegations relate to financial products, and only 5% relate to non-financial product defects.
13 Our dismissal statistics include summary judgments and verdicts for defendants but exclude partial dismissals. Due to the nature of dismissal data, on one hand, our dismissal counts in this section may be slightly overstated because they may include some dismissals without prejudice that will be reversed by amended and better-pled complaints, dismissals with prejudice that will be successfully appealed, or cases that will settle after a dismissal without prejudice and before the expiration date for plaintiffs to re-file an amended complaint. On the other hand, dismissal counts may be slightly overstated because we currently do not track dismissals with prejudice that subsequently settled or reverted to pending status. These two effects tend to offset one another.
14 Our statistics in this regard do not count in the numerator dismissals of cases that subsequently settled or reverted to pending status.
15 The DC Circuit is not included in Figure 13 due to the small number of cases filed and resolved in that jurisdiction.
Please click on the following link to view 2008 Trends: Subprime And Auction-Rate Cases Continue To Drive Filings, And Large Settlements Keep Averages High in its entirety, inclusive of all charts, footnotes and glossary of terms.
The content of this article is intended to provide a general guide to the subject matter. Specialist advice should be sought about your specific circumstances.