

2012 Highlights in Filings
- In 2012, securities class action filings were at their lowest levels since 2007, though the decline in filings was not dramatic
- Financial institutions no longer focus of litigation
Analysis of Motions
- Motions to dismiss granted at higher rate since 2005
- Proportions of motions to dismiss granted vary widely by circuit
Year 2012 Highlight in Dismissals and Settlements
- Number of cases resolved (settled or dismissed) lowest since 1996
- Median settlement amounts highest since 1996
- Plaintiffs' attorneys' fees decreasing for settlements of (almost) all sizes
INTRODUCTION AND SUMMARY
While the wave of credit-crisis related litigation ended in 2012, and the spate of cases with Chinese defendants also abated, merger objection cases continued to fill in much of the gap. In aggregate, the number of securities class action filings in federal courts in 2012 was only slightly below the levels in recent years.
A more pronounced change in the mix of defendants has occurred than the changing mix of case types would predict. Financial sector firms' share of filings in 2012 was not only far below the peak reached in the credit crisis, it was smaller than it has been since 2005. Further, accounting firms, which have historically been named as codefendants in a substantial proportion of cases, were named in only two securities class actions in 2012.
In sharp distinction to the relatively stable pace of new case filings, 2012 saw the fewest settlements since at least 1996. The number of dismissals was the lowest since 1998. The slow rate of both dismissals and settlements suggests that the litigation process as a whole proceeded more slowly in 2012.
For the modest number of cases that were actually settled in 2012, settlement values were near their average level of recent years, up from the relatively low level of 2011. Plaintiffs' attorneys' fees, by contrast, have decreased.
We report new findings from our extended analysis of the status of different motions. One notable finding is that a greater fraction of motions to dismiss has been granted in recent years. Further, we find that the rate at which such motions are granted varies substantially across the circuits, with the Fourth Circuit granting the largest portion and the Tenth Circuit the smallest.
TRENDS IN FILINGS2
Number of Cases Filed
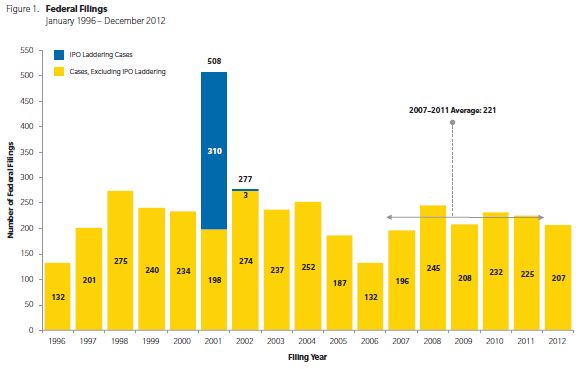
In 2012, securities class action filings were at their lowest levels since 2007, though the decline is not dramatic. A total of 207 lawsuits were filed in federal courts in 2012, somewhat below the average rate of 221 over the previous five years. See Figure 1. There was a slowdown in the pace of filings during the second half of 2012, relative to the first half of the year.
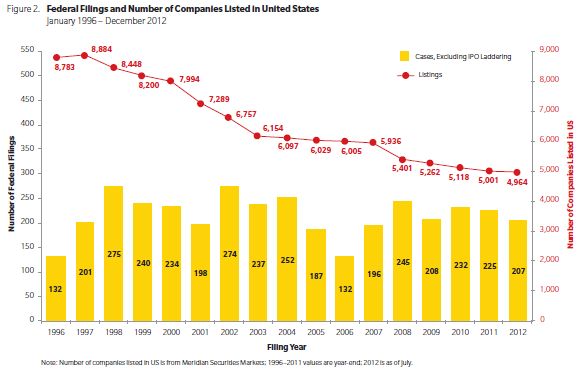
While filings have fluctuated both up and down historically, the number of publicly listed companies in the US has continued to decrease. Another small drop occurred in 2012, bringing the decline since 1996 to more than 43%. The implication of this decline is that an average company listed in the US was 68% more likely to be the target of a securities class action in the last five years than it was from 1996-2000. See Figure 2.
Filings by Type
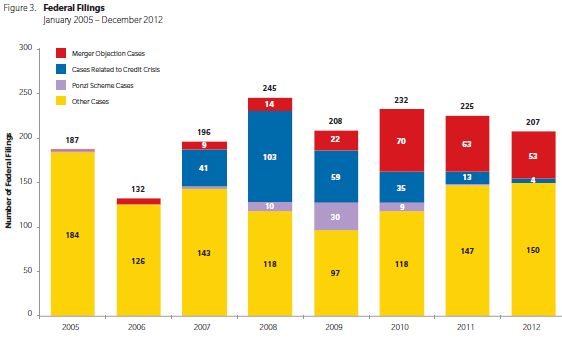
Important changes in the mix of filings have occurred over the last few years. Cases related to the credit crisis have dwindled from a high of 103 in 2008 to only four in 2012.3 And even these four appear to be less than typical: for example, one of them was filed in US federal court under British law.4 No cases with Ponzi scheme allegations were filed in 2012, whereas 30 such cases were brought in 2009. Merger objection cases remain an important subset, accounting for more than 25% of total filings in 2012, though down from a peak of 30% in 2010. See Figure 3. In 2012, 53 merger objection cases were filed in federal court; 33 of these allege a violation of Section 14 of the Securities Exchange Act, while another 20 allege breach of fiduciary duty, but no violation of federal securities law. The large number of merger objection cases filed since 2009 is one reason filings have not fallen back to pre-credit crisis levels. While the counts in Figure 3 show the recent prominence of such cases among federal filings, they do not capture the full scope of this activity, as many more merger objection cases are filed in state courts.
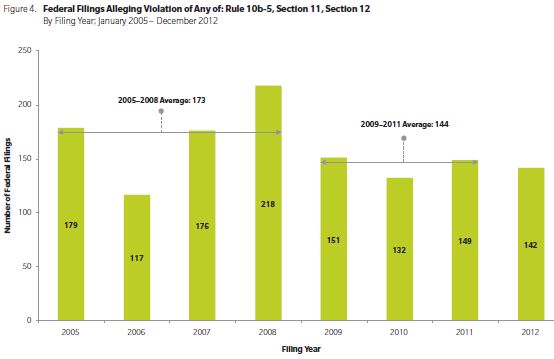
Filings alleging violations of Rule 10b-5, Section 11, and/or Section 12 are often regarded as "standard" securities class actions. The pace of such "standard" filings has fallen in recent years, while total filings have been relatively flat. The emergence of merger objection litigation explains much of this difference. Cases alleging breach of fiduciary duty in connection with executive compensation also contribute to the difference. "Standard" securities class actions averaged 173 over the period from 2005-2008. Since then, such filings have averaged only 144 cases annually during 2009-2011, and 2012 levels were just below that, at 142. See Figure 4.
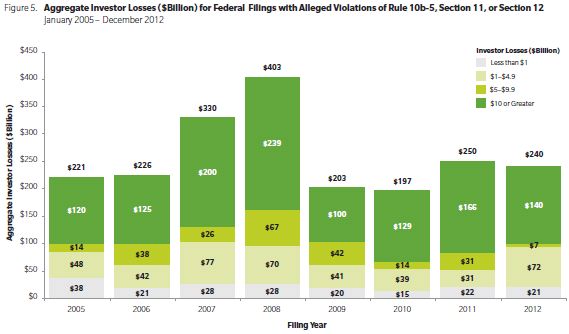
In addition to the number of filings, we also analyze the size of the cases that they represent using a measure we label "investor losses." Aggregate investor losses as shown in Figure 5 are simply the sum of total investor losses across all cases for which investor losses can be computed.
|
NERA's investor losses variable is a proxy for the aggregate amount that investors lost from buying the defendant's stock rather than investing in the broader market during the alleged class period. Note that the investor losses variable is not a measure of damages since any stock that underperforms the S&P 500 would have "investor losses" over the period of underperformance; rather, it is a rough proxy for the relative size of investors' potential claims. Historically, "investor losses" have been a powerful predictor of settlement size. Investor losses can explain more than half of the variance in the settlement values in our database. We do not compute investor losses for all cases included in this publication. For instance, class actions in which only bonds and not common stock are alleged to have been damaged are not included. The largest excluded groups are the IPO laddering cases and the merger objection cases. Previous NERA reports on securities class actions did not include investor losses for cases with only Section 11 allegations, but such cases are included here. The calculation for these cases is somewhat different than for cases with 10b-5 claims. Technically, the investor losses variable explains more than half of the variance in the logarithm of settlement size. Investor losses over the class period are measured relative to the S&P 500, using a proportional decay trading model to estimate the number of affected shares of common stock. We measure investor losses only if the proposed class period is at least two days. |
Aggregate investor losses for 2012 were slightly below the level observed in 2011, but they have been generally increasing since 2009. Although about half of the cases filed between 1996 and 2012 have investor losses of less than $500 million, in total these cases account for only 5% of aggregate investor losses. The bulk of aggregate investor losses is represented by a handful of cases in each year with investor losses of more than $10 billion, so that most year-to-year variation in aggregate investor losses is the result of variation in these large cases.
Filings by Issuers' Country of Domicile5
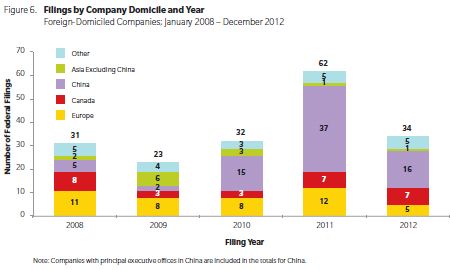
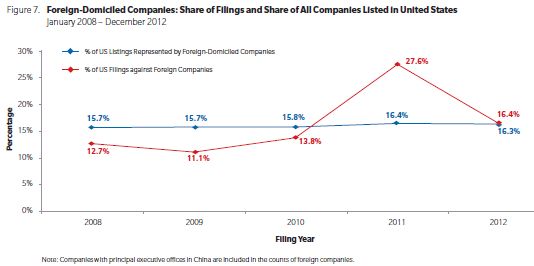
In 2011, a record number of cases were filed against foreign issuers, with a total of 62. More than half of those cases (37) reflected a surge of filings against companies domiciled or with principal executive offices in China. Filings against Chinese companies dropped significantly in 2012, though, with only 16 suits filed. See Figure 6. Filings against all foreign-domiciled companies were also down in 2012, and back to their pre-2011 levels. As mentioned in our mid-year 2012 report, the requirements for listing in the US through the reverse merger process have become more stringent, including the requirement that the company trade elsewhere for a one-year "seasoning period."6 Additionally, The Wall Street Journal has reported that the number of Chinese companies listed on the NYSE and Nasdaq has declined 20% since 2010.7
Filings by Circuit
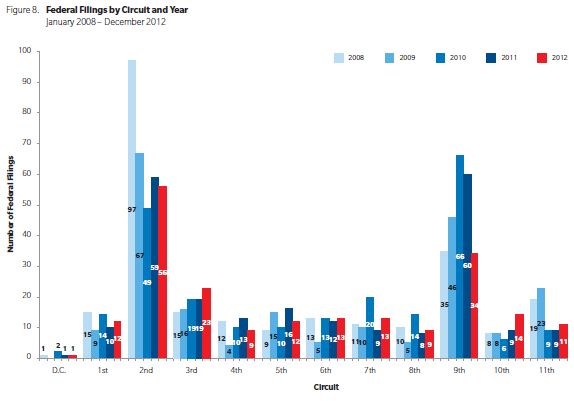
Filings continue to be concentrated in two US circuits: the Second Circuit, including New York State, and the Ninth Circuit, including California. In 2012, 56 cases were filed in the Second Circuit and 34 in the Ninth, accounting for over 43% of all filings. Filings in the Ninth Circuit dropped significantly, however, and were about half of the previous year's level. This level was one of the lowest since 1996, after the passage of the Private Securities Litigation Reform Act (PSLRA). See Figure 8.
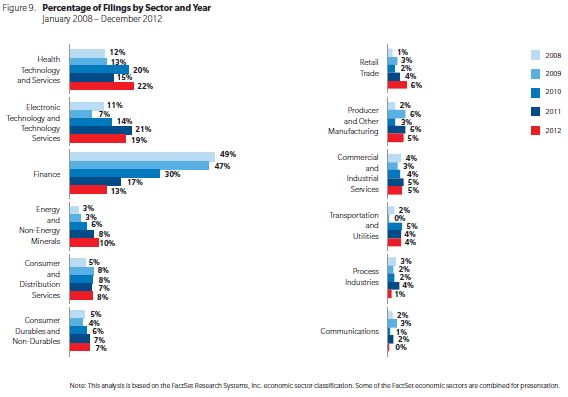
Filings by Sector
The health technology and services sector remains a prime target for litigation. The percentage of securities class action filings against companies in this industry increased to 22% in 2012, from 12% in 2008 and 15% in 2011. The share of filings in the energy and non-energy minerals sector also grew to almost 10% in 2012 from 8% in the previous year. See Figure 9.
Filings against primary defendants in the finance sector have continued to decline, from a peak of nearly half of all securities class actions during the credit crisis years of 2008 and 2009, to less than 13% in 2012. Companies in the electronic technology and technology services industry have been targeted slightly less frequently this year, accounting for 19% of filings in 2012, down from 21% in 2011.
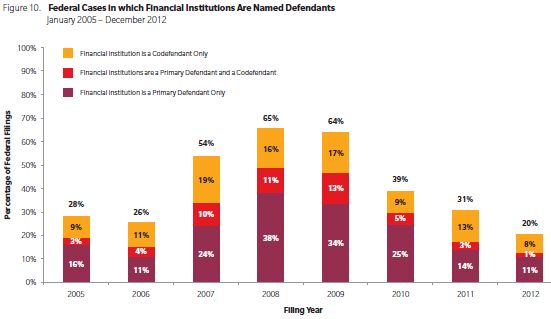
The above statistics refer to companies named as primary defendants in securities class actions. Companies in the finance industry have also been named as codefendants. Figure 10 shows that 8% of filings in 2012 involved a financial institution as a codefendant, but not a primary defendant. Including cases in which they were named as a co-defendant and/or a primary defendant, however, the percentage of federal filings involving a financial company is still only 20%, the lowest level since at least 2005.8
Accounting Codefendants
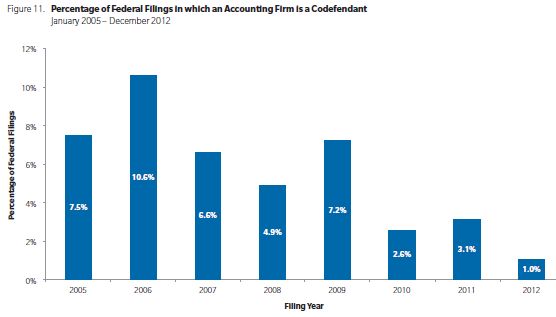
Only two federal securities class actions included an accounting codefendant in 2012, and neither of these cases involved one of the big four accounting firms. This represents a substantial change since 2005-2009, when on average 6.9% of cases named accounting codefendants, and continues the decline following the roughly 3% observed during 2010-2011. See Figure 11. These figures are based on the initial complaint; in the past, accounting codefendants were added relatively often to cases subsequently.9
In our mid-year 2012 report, we noted that this trend might be the result of changes in the legal environment. The Supreme Court's Janus decision in 2011 restricted the ability of plaintiffs to sue parties not directly responsible for misstatements, and as a result, auditors may only be liable for statements made in their audit opinion. This decision, along with the Court's Stoneridge decision in 2008, which limited scheme liability, may have made accounting firms unappealing targets for securities class action litigation.
Allegations
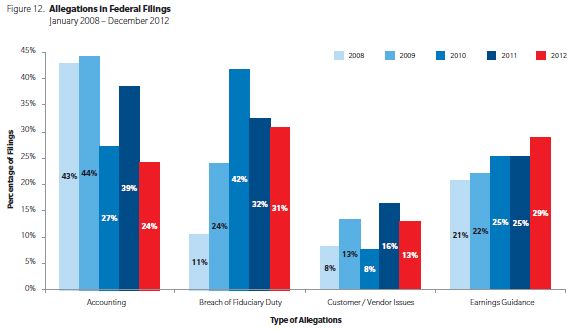
In 2012, 31% of filings contained allegations of breach of fiduciary duty, similar to the percentage in the previous year. Allegations involving misleading earnings guidance continued to increase to 29% of complaints in 2012, up from 21% in 2008 and 25% in 2011. Almost a quarter of filings included accounting allegations, down from 44% in 2008-2009, at the height of the wave of credit crisis litigation. The decline in accounting allegations may also explain some of the reduction in cases with accounting codefendants. See Figure 12.
Most complaints include a wide variety of allegations, not all of which are depicted here. Due to multiple types of allegations in complaints, the percentages in Figure 12 sum to more than 100%.
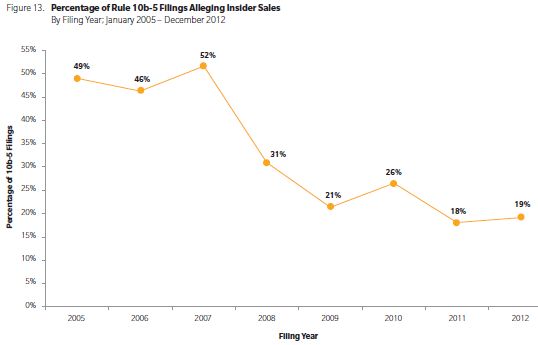
In 2012, 19% of class actions with Rule 10b-5 allegations also alleged insider sales, which is slightly higher than the fraction observed in the prior year. However, the share of such filings has been drifting downward, with 2012 at just over one-third the level in 2007. See Figure 13.
Time to File
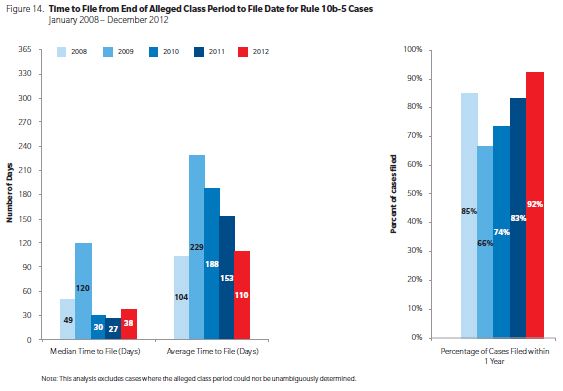
Plaintiffs' attorneys have been responding to stock price drops with ever-increasing speed, and the time from the end of the alleged class period to first filing has been decreasing since 2009. In 2012, the average time to file was 110 days, down from a high of 229 days in 2009 and 153 days in 2011. The percentage of cases that are filed within one year has unsurprisingly also been increasing, from 66% in 2009 to 92% in 2012. See Figure 14.
Unlike the average time to file, the median time to file is up slightly since 2011. Half of the complaints in 2012 were filed within 38 days of the end of the class period, up from 27 days in 2011.
ANALYSIS OF MOTIONS
In an important addition to our analysis of class actions, starting with our most recent mid-year report, we have analyzed trends in the different motions and their resolutions for federal securities class actions filed and settled in 2000 or later.10 We have now also coded data for cases that were resolved without settlement, in addition to the settled cases analyzed in our earlier work.11 Cases resolved without settlement include cases that are dismissed, including voluntary dismissal, or are terminated by a successful motion for summary judgment or an unsuccessful motion for class certification. Specifically, our data cover motions to dismiss, motions for class certification, and motions for summary judgment. These data allow new insight to be gained into the litigation process for securities class actions.
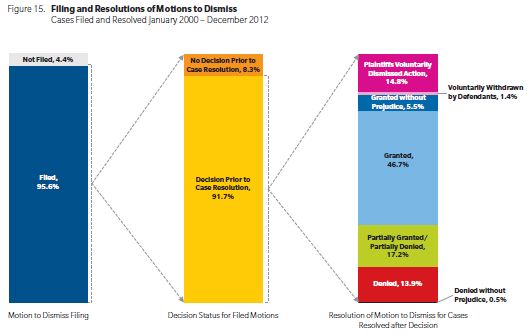
A motion to dismiss was filed in more than 96% of all cases. Of the 4% of cases without a motion to dismiss, virtually all ended with settlements. While motions to dismiss are almost always filed, in many cases we never observe their resolution. Specifically, in 20% of settled cases where a motion to dismiss had been filed, settlement was reached before the court reached a decision. Note that for settled cases, we record the status of any motions at the time of settlement. For example, if a case has a motion to dismiss granted but then denied on appeal, followed immediately by settlement, we would record the motion as denied.
Next we turn to the resolution of motions to dismiss. See Figure 15. For cases in which we observed the decision of the court:
- 47% of the motions were granted;12
- 15% were voluntarily dismissed by plaintiffs;
- 14% of the motions were denied in their entirety; and
- 17% of the motions were granted in part. This sort of resolution typically alters the class period, removes some classes of assets, or removes some defendants.
In total, then, 31% of cases continued past the motion to dismiss, at least in part. In an additional 5% of cases, dismissal was granted, though without prejudice.
The stated success rate for motions to dismiss reflects the outcome at the time the case was resolved. More motions to dismiss that were successful might have been overturned, but instead resulted in settlements before further appeals were concluded. About 8% of cases in which the motion to dismiss was granted with prejudice or in its entirety resulted in settlements.
Some changes have occurred over time in the patterns of resolutions to the motion to dismiss. In recent years, motions to dismiss have been granted somewhat more frequently. For cases filed in 2005 or earlier, 45% of the motions to dismiss were granted, while that figure increased to 50% for cases filed after 2005. An even larger increase occurred in the fraction of cases that have been voluntarily dismissed by plaintiffs, with figures of 22% for post-2005 cases and 10% for earlier matters.
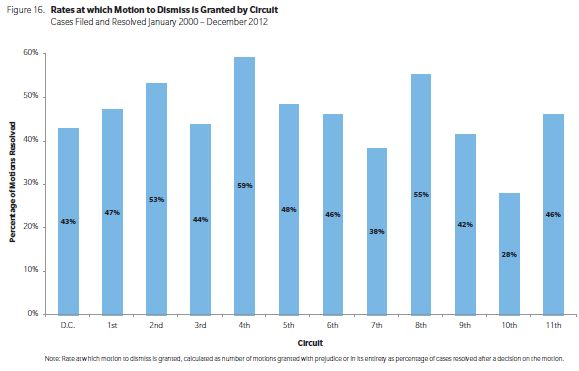
Systematic differences have been observed in the rate at which motions to dismiss are granted across the circuits. Focusing on the fraction of motions to dismiss granted in their entirety or with prejudice, the rates at which dismissals are granted by courts has varied from 28% in the Tenth Circuit up to 59% in the Fourth Circuit. See Figure 16. For the Second and Ninth Circuits, where many securities class actions are filed, the rates were 53% and 42% respectively. These differences may not be entirely caused by different standards across the circuits; there may also be systematic differences in the types of cases brought in different circuits.
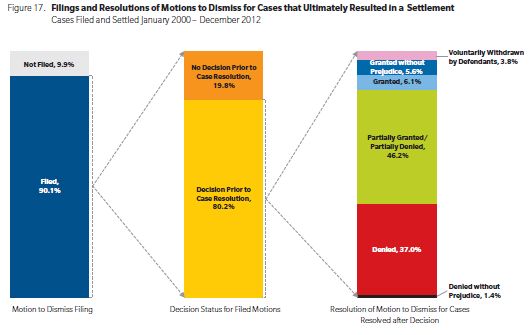
Another way to look at the outcome of the motion to dismiss is to consider the status for only those cases that were actually settled.13 Inside this group, the most frequent outcome, at 46%, was that the motion was partially granted and partially denied, while in a further 37% of cases it was simply denied. The other outcomes are summarized in Figure 17.
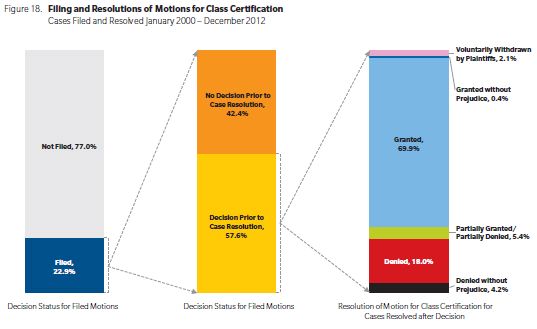
Most cases are resolved before a motion for class certification is filed; 77% of cases fall into this category. Another 10% of cases were resolved before any decision was reached on class certification. In 75% of the cases where decision was reached on the motion for class certification, the class was certified, at least in part. In 18% of cases, the motion was denied with prejudice or in its entirety. See Figure 18 for more details.
The fraction of classes certified has fallen slightly in recent years. For cases filed in 2005 or before, 76% were certified, while the figure is 72% for more recent cases. This difference, however, is not statistically significant.
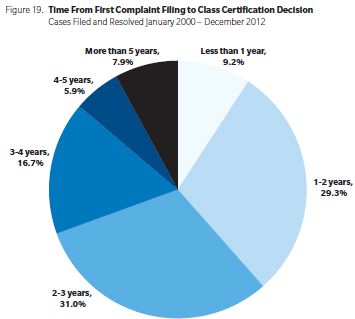
While relatively few cases proceed to the point at which a decision on class certification is reached, the cases that get to this point provide a measure of the overall speed of the legal process. For cases with a decision, more than three-quarters of such decisions came within three years of the original filing date of the complaint. See Figure 19. The median time is about 2.3 years. The speed of the process has remained relatively constant over time, with cases filed before 2006 getting to class certification in about the same time as cases filed later.
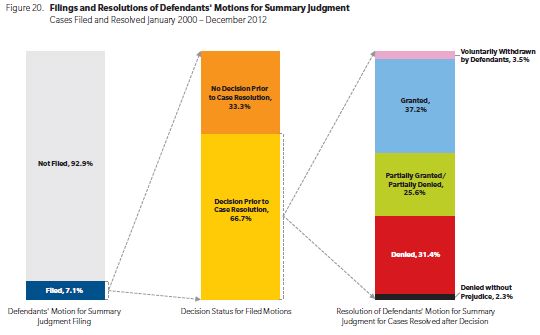
Motions for summary judgment are comparatively rare. Only 9% of resolved cases saw such a motion filed by either side of the litigation. In all but a handful of these cases, the motion for summary judgment was filed by defendants. See Figure 20 for details on the outcomes of summary judgment motions filed by defendants.
It will come as no surprise that the outcomes of different motions affect settlement values. However, our research has found that the relationship between settlement values and motion status is complex, partly because strategic considerations of the litigants can have an important influence on the stage at which a settlement occurs. Despite this complexity, we have found that there are statistically robust relationships between motion status and ultimate settlement values, when other case characteristics are taken into account. Analysis of these effects goes beyond the scope of the present paper, but discussion of some our findings can be found in the recent paper "Dynamic Litigation Analysis: Predicting Securities Class Action Settlements as a Case Evolves."14
TRENDS IN CASE RESOLUTIONS
Number of Cases Settled or Dismissed
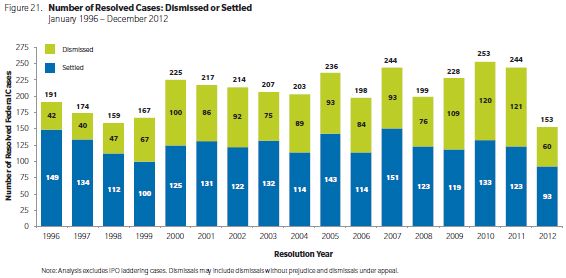
One of the most remarkable trends in securities litigation during 2012 is that only 153 securities class actions were resolved last year. That is, only 153 were settled or dismissed, and none reached a verdict. 15 (In this section, for brevity, we use "dismissed" to refer to all cases that are resolved without a settlement, as described above.) This is the smallest number of cases resolved since 1996, after the passage of the PSLRA. See Figure 21. It corresponds to a 37% reduction from 2011, when 244 securities class actions were resolved. Both the number of settlements and the number of dismissals have declined substantially compared to recent years.
Only 93 securities class actions settled in 2012—also a record low since 1996 and a 25% reduction from 2011, when 123 cases settled. Among these 93, the number of settlements that provided monetary compensation for the class was even smaller, at 65. The other 28 settlements reached in 2012 provided no monetary compensation for the class. All of these zero dollar settlements were merger objection cases, which often provide only for additional disclosures and plaintiffs' attorneys' fees and expenses. In 2011, 34 settlements provided no monetary compensation for the class, slightly higher than this past year, but the cash settlements were also higher at 89.
A similarly small number of dismissals occurred. Specifically, only 60 cases were dismissed in 2012—the smallest number since 1998, representing a more than 50% reduction in the number of dismissals since last year.
As we discussed in a previous publication, reasons for this reduction in the number of cases resolved include the reduction in the number of cases awaiting resolution at the beginning of 2012 and a deceleration in the speed of resolutions. The drivers of this deceleration are not fully known; it will be interesting to observe whether resolutions pick up pace again after the Supreme Court decides the Amgen case.
Dismissal Rates
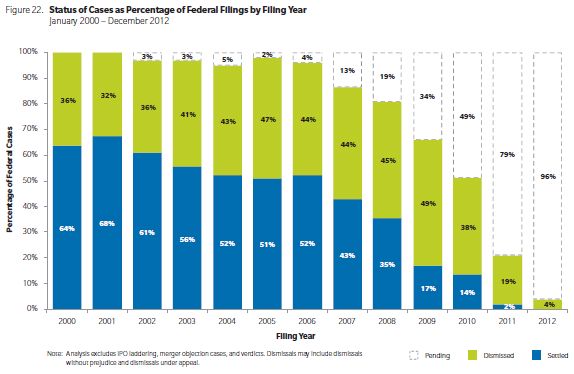
Dismissal rates appear to be rising. Figure 22 shows the dismissal rate calculated as follows: cases ultimately dismissed as a fraction of all cases filed in a given year. Almost all cases filed from 2000 to 2006 have been resolved. Dismissal rates in those years have progressively increased from 32%-36% in 2000-2002 to 43%-47% in 2004-2006.16 On a preliminary basis, it appears that dismissal rates continued to increase in 2007 to 2009, as 44%-49% of cases filed in those years have already been dismissed. However, the ultimate dismissal rate for cases filed in these more recent years is less certain. On one hand, it may increase further as there are more cases awaiting resolution. On the other hand, it may decrease because recent dismissals are more likely than older ones to be appealed or re-filed, and may ultimately result in settlements.17 For cases filed during 2010 to 2012, it is too early to tell whether the trend of increasing dismissal rates continues; the resolutions we have observed for cases filed in recent years are likely dominated by the fact that dismissals tend to happen faster than settlements.
Time to Resolution
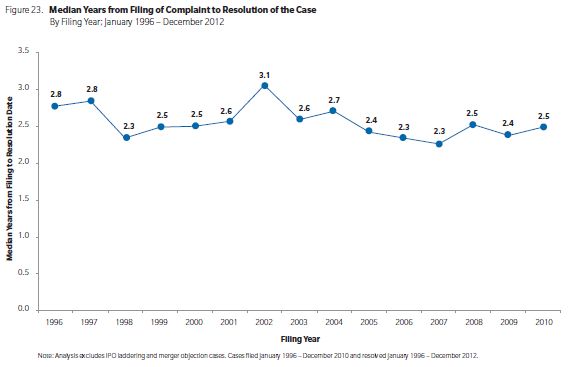
With a variable called "time to resolution," we measure the time between case filing and resolution (whether settlement or dismissal). We group cases by the year in which they were filed and show median time to resolution across these filing years. For each filing year for which at least 50% of the cases have resolved, the median time to resolution is accurate even if some of the cases are still pending. The most recent filing year for which this computation is possible is currently 2010.
Median time to resolution has oscillated between 2.3 and 3.1 years in the period 1996-2010 and has been remarkably stable, between 2.3 and 2.5 years, in the sub-period 2005-2010, if IPO laddering cases and merger objection cases are excluded. See Figure 23.
If merger objection cases are included, then time to resolution shows a sharp drop to 2.0 years in 2009 and 1.5 years in 2010. Merger objections are known to resolve quickly, so it is unsurprising that their inclusion reduces the median.
Also unsurprising is that the inclusion of IPO laddering cases brings the median time to resolution for cases filed in 2001 to 7.8 years, given that they were filed then and not resolved until 2009.
TRENDS IN SETTLEMENTS
Settlement Amounts
The biggest settlements once again grabbed the biggest headlines in 2012; in particular, the $2.43 billion Bank of America settlement related to its acquisition of Merrill Lynch drew media attention. That settlement has not yet obtained judicial approval, however; therefore, consistent with our protocol, it is not included in our settlement statistics.18
The average settlement amount in 2012 was $36 million, which is within the range of average settlement amounts in recent years. See Figure 24. The average settlement amount in 2012 is slightly above the $35 million average over 2007-2011. The average calculation excludes settlements above $1 billion, settlements in IPO laddering cases, and settlements in merger objection cases. The settlements over $1 billion have a large impact on averages, while the IPO laddering cases and merger objection cases are atypical; inclusion of any of these may obscure trends in more usual cases.
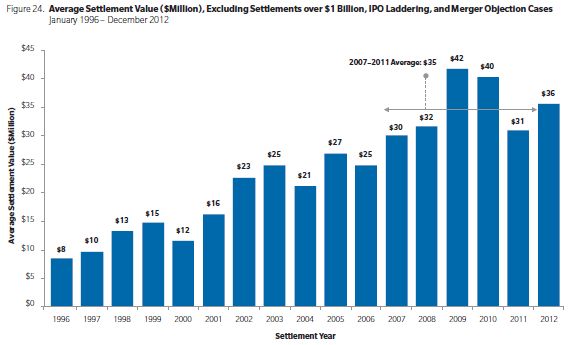
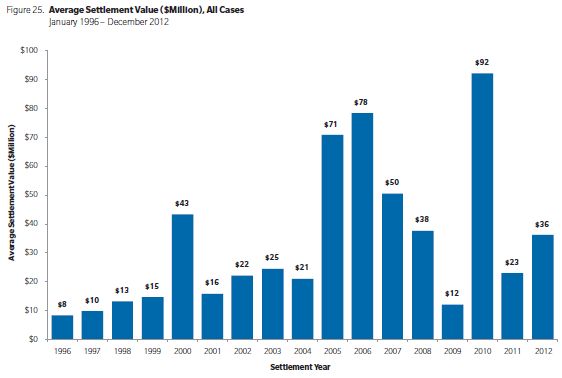
For completeness, Figure 25 shows average settlements if all cases are included. Coincidentally, the average settlement amount in 2012 is also $36 million with all cases included. This outcome is because the effect of one settlement over $1 billion (AIG, the fourth tranche of which was approved in 2012) is offset by 30 settlements in merger objections cases, 28 of which provided no monetary compensation.
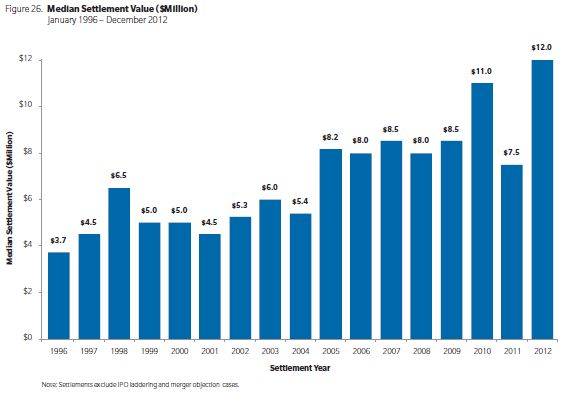
Another way to look at typical settlement values is to examine the median settlement, i.e., the value that is larger than half of the settlement values in that year. Medians are more robust to extreme values than averages. The median settlement amount in 2012 was $12 million, the highest since passage of the PSLRA. Last year, 2012, was only the second year in which the median settlement exceeded $10 million. See Figure 26.
This figure also shows an increasing trend in median settlement amounts between 1996 and 2012, from $3.7 million in 1996 to $12.0 million in 2012, a 324% increase. Naturally, part of this increase is due to inflation. After adjusting for inflation, the 1996 median settlement was $5.5 million and the increase from then to 2012 was 218%.
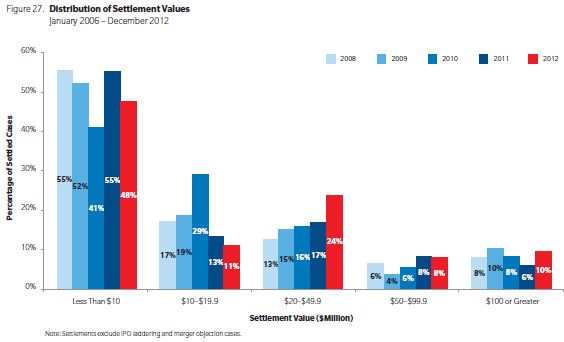
We also analyzed whether the large drop in the number of settlements in 2012 as compared to 2011 is concentrated in settlements of a particular size. Figure 27 shows that it is not. The decrease has been roughly proportional for small, medium, and large settlements. That is, in spite of the record median settlement, the distribution of settlements of different sizes in 2012 is similar to that in recent years.
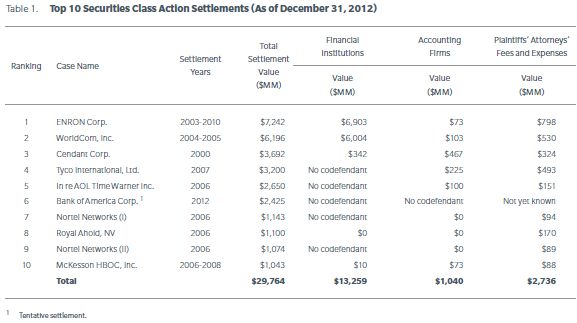
The 10 largest securities class action settlements of all time are shown in Table 1. The new addition to the list in 2012 is the $2.43 billion Bank of America settlement associated with the acquisition of Merrill Lynch announced last year and still pending approval. If approved, it will be the sixth largest settlement ever.
Aggregate Settlements
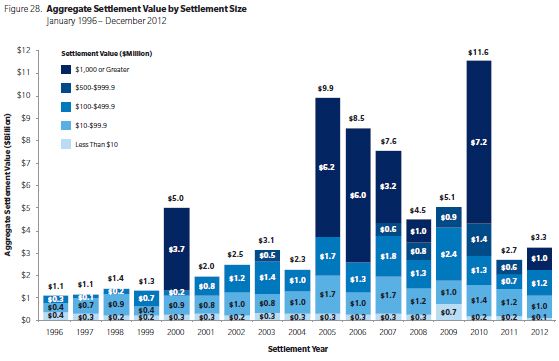
The total dollar value of all settlements in 2012 exceeded $3 billion. See Figure 28. Just over $1 billion is represented by the AIG settlement, which is included in 2012 because the fourth tranche was approved in that year.
In the figure, it is evident that the large fluctuations in aggregate settlements over the years are driven by the settlements over $1 billion. If those settlements are excluded, aggregate settlements in the years 2007 to 2010 have ranged between $3.5 and $5.1 billion, but decreased to $2.7 billion in 2011 and $2.3 billion in 2012.
Relatively small settlements, those under $10 million, account for about half of all settlements. While these small cases are numerous, they account for a very small fraction of aggregate settlements, as can be seen by contrasting Figures 27 and 28. The total dollar values are driven by big settlements.
Investor Losses Versus Settlements
As noted above, our investor losses variable is a proxy for the aggregate amount that investors lost from buying the defendant's stock rather than investing in the broader market during the alleged class period.
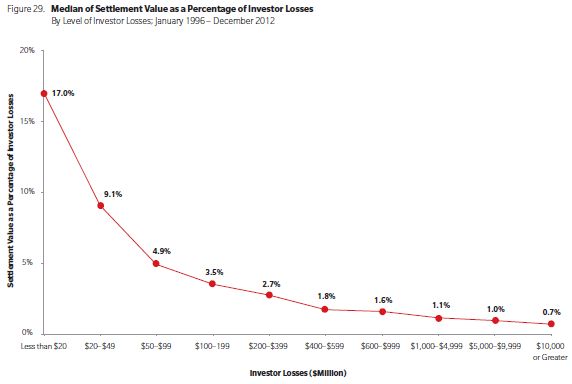
In general, settlement sizes grow as investor losses grow, but the relationship is not linear. Settlement size grows less than proportionately with investor losses, based on analysis of data from 1996 to 2012. Small cases typically settle for a higher fraction of investor losses (i.e., more cents on the dollar) than larger cases. For example, the median settlement for cases with investor losses of less than $20 million has been 17% of the investor losses, while the median settlement for cases with investor losses over $1 billion has been 0.7% of the investor losses. See Figure 29. Our findings on the ratio of settlement to investor losses should not be interpreted as the share of damages recovered in settlement but rather as the recovery compared to a rough measure of the "size" of the case.
We also computed the median ratios of settlements to investor losses for 2010 to 2012 to see if the relationship between investor losses and settlements had changed in recent years. We found the 2010-2012 pattern to be very similar to that shown in the Figure.
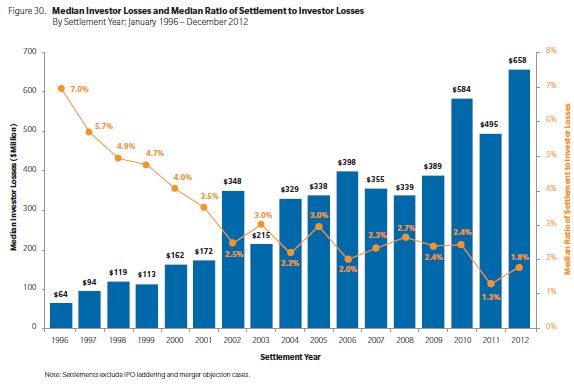
Median investor losses for settled cases have been steadily increasing since the passage of the PSLRA. As just described, the median ratio of settlement to investor losses decreases as investor losses increase. Indeed, the increase in median investor losses over time translated to a decrease of the median ratio of settlement to investor losses. In 2012, the ratio was 1.8%. See Figure 30.
Plaintiffs' Attorneys' Fees and Expenses
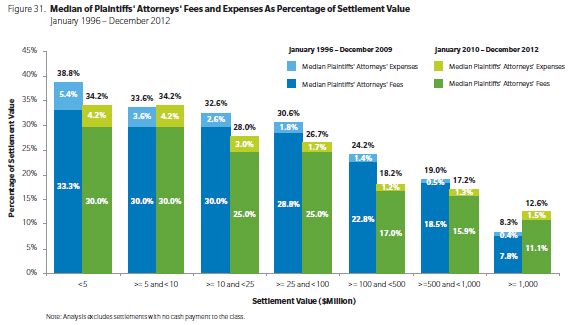
Usually, plaintiffs' attorneys' remuneration is awarded as a fraction of any settlement amount in the form of fees plus expenses. Figure 31 depicts plaintiffs' attorneys' fees and expenses as a proportion of settlement values.19 The data shown in this Figure exclude merger objection cases.
Typically, fees and expenses grow with settlement size but less than proportionally, i.e., the percentage fees and percentage expenses shrink as the settlement size grows. Here, we describe the patterns taking the period 2010–2012 as an example. For settlements below $5 million, median fees and expenses represented 34.2% of the settlement. This percentage falls with settlement size, reaching 12.6% for settlements above $1 billion.
To highlight trends over time, we show side-by-side the median proportions of fees and expenses for the period 1996–2009 and those for the period 2010–2012. Over the period 2010–2012, fees have declined markedly compared to 1996–2009, at least for most settlement size ranges. An exception is fees on settlements above $1 billion, but there are only two such settlements in the later period.
Another classification of fees that may be informative is the following: taking all cases that settled in the period 1996–2012, the vast majority of those settling for less than $100 million are associated with a fee percentage of 25%, 30%, or 33%. For cases settling for more than $100 million, the fee percentages associated with them range very widely, with cases that settle for more than $500 million typically being associated with lower fee percentages.
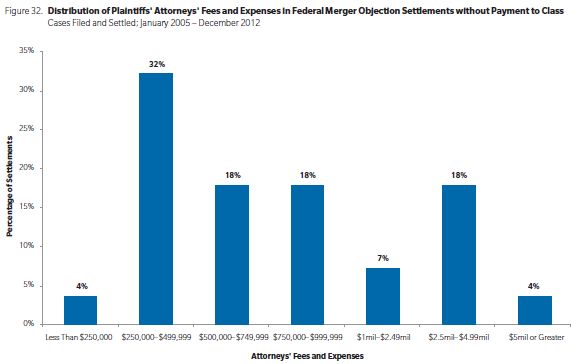
We report fees for federal merger objection cases separately, because merger objections often settle with no payment to investors. Many merger objection cases are voluntarily dismissed at the federal level because a parallel state action settled; these cases are excluded from Figure 32, below.
Of the cases that settled with no payment to investors, 72% had fees and expenses of less than $1 million.20 See Figure 32.
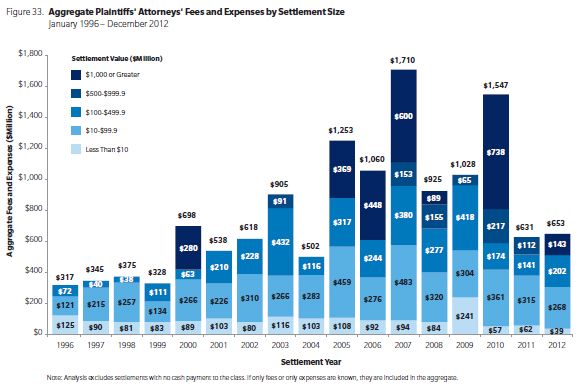
Aggregate plaintiffs' attorneys' fees and expenses for all federal settlements were $653 million in 2012. This amount represents an increase of 4% compared to last year, but is well below the levels received in the period 2007-2010—even if the aggregate fees in that period corresponding to settlements exceeding $1 billion are excluded.
Although approximately half of the securities class actions that settle do so for less than $10 million, the aggregate plaintiffs' attorneys' fees and expenses for those settlements are a very small fraction of the total. See Figure 34. This finding is parallel to the finding, described above, that such cases make up a small fraction of total settlements.
Characteristics of Settled Cases
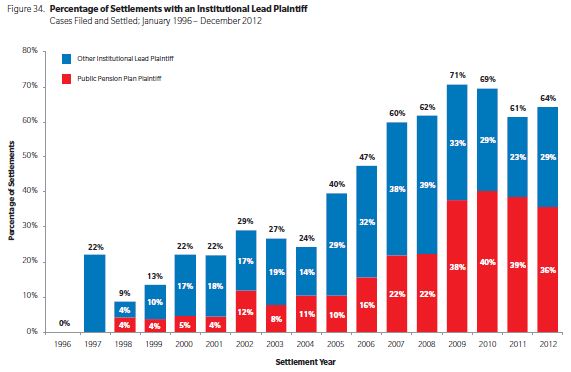
Our research shows that securities class actions where the lead plaintiff is an institutional investor settle for more, even accounting for other factors, such as the size of investor losses. The same research also shows that when the institutional lead plaintiff is a public pension fund, settlements tend to be even larger.
In 2012, 64% of securities class actions had an institutional lead plaintiff; which is slightly above 2011's percentage and slightly below the 2009 peak of 71%. See Figure 35 for more detail on institutional and public pension fund lead plaintiffs.
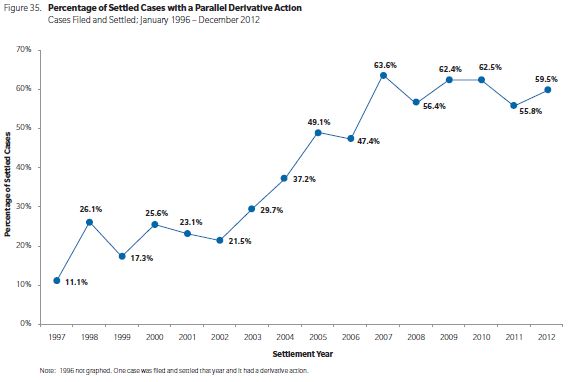
Securities class actions are sometimes accompanied by derivative actions based on similar or identical allegations. The prevalence of these "tag along" derivative actions has been increasing over the last 10 years, and they were filed in 60% of the securities class actions that settled in 2012. Our research has found that the presence of a derivative action is associated with larger settlements for investors in the class action.
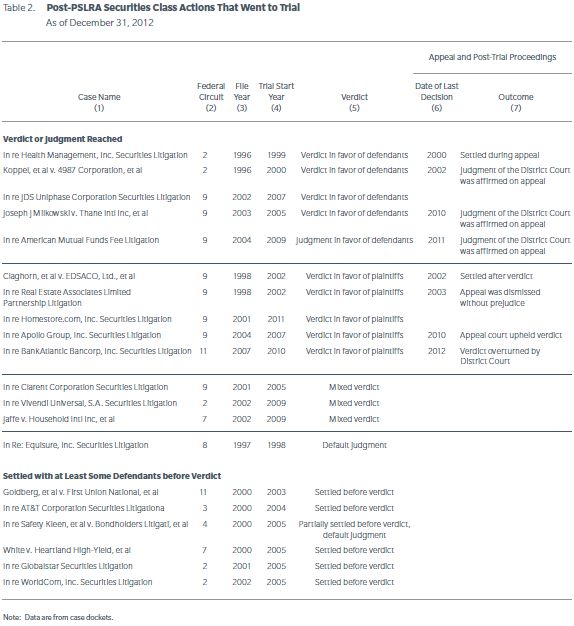
TRIALS
Very few securities class actions reach the trial stage and even fewer reach a verdict. Of the 3,988 class actions filed since the PSLRA, only 20 went to trial and only 14 of them reached a verdict.21 Table 2 summarizes trial outcomes and, when applicable, outcome of the appeals.
Footnotes
1 This edition of NERA's research on recent trends in securities class action litigation expands on previous work by our colleagues Lucy Allen, Elaine Buckberg, the late Frederick C. Dunbar, Todd Foster, Vinita M. Juneja, Denise Neumann Martin, Jordan Milev, John Montgomery, Robert Patton, Stephanie Plancich, and David I. Tabak. We gratefully acknowledge their contribution to previous editions as well as this current version. The authors also thank Denise Martin for helpful comments on this version. In addition, we thank Carlos Soto, Nicole Roman, and other researchers in NERA's Securities and Finance Practice for their valuable assistance with this paper. These individuals receive credit for improving this paper; all errors and omissions are ours. Data for this report are collected from multiple sources, including RiskMetrics Group/Securities Class Action Services (SCAS), complaints, case dockets, Dow Jones Factiva, Bloomberg Finance L.P., FactSet Research Systems, Inc., SEC filings, and the public press.
2 NERA tracks class actions filed in federal courts that involve securities. Most of these cases allege violations of federal securities laws; others allege violation of common law, including breach of fiduciary duty as with some of the merger objection cases and some cases on managerial compensation; still others are filed in US federal court under foreign law or are removed to federal court through CAFA. If multiple such actions are filed against the same defendant, are related to the same allegations, and are in the same circuit, we treat them as a single filing. However, multiple actions filed in different circuits are treated as separate filings. If cases filed in different circuits are consolidated, we revise our count to reflect that consolidation. Therefore, our count for a particular year may change over time. Different assumptions for consolidating filings would likely lead to counts that are directionally similar but may, in certain circumstances, lead observers to draw a different conclusion about short-term trends in filings.
3 We have classified cases as credit crisis-related based on the allegations in the complaint. The category includes cases with allegations related to subprime mortgages, mortgage-backed securities, and auction-rate securities, as well as some other cases alleged to involve the credit crisis. Our categorization is intended to provide a useful picture of trends in litigation but is not based on detailed analysis of any particular case.
4 Rentokil-Initial Pension Scheme v. Citigroup Inc., et al.
5 For all countries other than China, we use the country of domicile for the issuing company. Many of the defendant Chinese companies, however, obtained their US listing through a reverse merger and, consequently, report a US domicile. For this reason, the Chinese counts also include companies with their principal executive offices in China.
6 See, for example, www.sec.gov/news/press/2011/2011-235.htm.
7 See, for example: Chu, K. (2012, December 6). As Listings Declined, Exchanges Hit the Road. The Wall Street Journal Online.
8 Note that in Figure 10 the percentages of federal cases in which financial institutions are named as defendants is computed on the basis of the first available complaint.
9 In past editions of Trends, we considered later complaints in analyzing accounting codefendants.
10 Cases for which investor losses are not calculated are excluded. The largest excluded groups are the IPO laddering cases and the merger objection cases.
11 It is possible that there are some cases that we have categorized as resolved that are or will in future be subject to appeal.
12 These are cases in which the language of the docket or decision referred to the motion being granted in its entirety or simply "granted", but not cases in which the motion was explicitly granted without prejudice.
13 These figures based on settled cases correspond to the figures reported in our mid-year review.
14 "Dynamic Litigation Analysis: Predicting Securities Class Action Settlements as a Case Evolves," Dr. Ronald I. Miller, NERA white paper, January 2013.
15 Unless otherwise noted, tentative settlements (those yet to receive court approval) and partial settlements (those covering some but not all non-dismissed defendants) are not included in our settlement statistics. We define "settlement year" as the year of the first court hearing related to the fairness of the entire settlement or the last partial settlement.
16 The dismissal rates shown here do not include resolutions for IPO laddering cases, merger objection cases, or cases with trial verdicts.
17 When a dismissal is reversed, we update our counts.
18 A different mega settlement is included in the 2012 analysis, the $1 billion settlement of AIG. Its inclusion is pursuant to our protocol of including cases with multiple partial settlements on the year of their latest partial settlement.
19 The settlement values that we report include plaintiffs' attorneys' fees and expenses in addition to the amounts ultimately paid to the class.
20 This percentage is computed for settlements for which fee information was available.
21 In past editions of "Trends" we had reported all class actions that went to trial after the PSLRA, including those that were filed before the PSLRA.
The content of this article is intended to provide a general guide to the subject matter. Specialist advice should be sought about your specific circumstances.
We operate a free-to-view policy, asking only that you register in order to read all of our content. Please login or register to view the rest of this article.