
INTRODUCTION
In the first half of 2011, securities class action lawsuits were filed at the second highest semi-annual rate in the last eight years. This has occurred despite a continuing decline in new credit crisis-related suits and last year's Morrison decision limiting the scope of US securities litigation against foreign companies. Credit crisis litigation has been replaced by a wave of new cases alleging breach of fiduciary duty in connection with mergers and acquisitions, and filings against foreign issuers have gone up notwithstanding Morrison, due to a surge in cases against Chinese companies that trade on US markets.
Filings have continued to migrate from the Second Circuit to the Ninth Circuit, as the fraction of cases filed against financial sector companies has fallen back to its historical average and the fraction against technology companies has recovered.
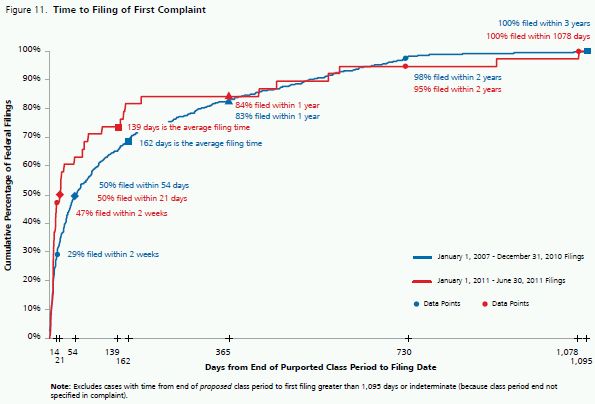
The median time from the end of the proposed class period to the first filing of a suit was much shorter in this period than in the previous four years: 21 days, down from 54.
After reaching an all-time high of $11 million in 2010, the median size of a class action settlement plunged to just over $6 million in the first half of 2011. The aggregate annual value of settlements is on track to be below $2 billion for the first time since 2001.
Perhaps reflecting increased concern by defendants about exposure from investors who opt out of a class action settlement and litigate independently, nearly a third of settlements approved in the first half of 2011—an all-time high—include a provision voiding the settlement if opt-out claims exceed a certain threshold.
Last year's verdict for plaintiffs in the first credit crisis-related securities class action trial, against BankAtlantic Bancorp, Inc. and individual codefendants, was set aside by the trial judge in April of this year.
The Supreme Court handed down three decisions in securities class actions. In Matrixx and Halliburton, it sided with plaintiffs on materiality and class certification, respectively. In Janus Capital, the Court sided with defendants in finding that only the corporate entity that actually makes a statement can be held liable for it under the federal securities laws. Whether any of these decisions will have a substantial effect on filings or settlements going forward remains to be seen.
Trends in Filings
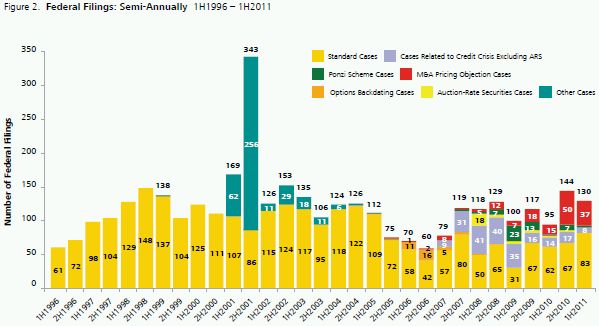
Securities class actions were filed over the first half of 2011 at a rapid pace, albeit not quite as briskly as in the second half of 2010.1 There were 130 filings from January to June of this year, more than in the first half of any year since 2003. See Figures 1 and 2. If activity continues at the same pace in the second half, there will be 260 filings in 2011, the highest level since 2002 and the fourth highest in the 16 years since the passage of the PSLRA. See Figure 1.
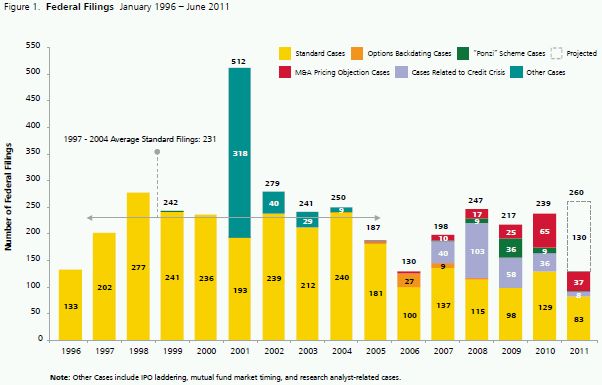
In 2010, we noted a decline in credit crisis-related litigation and resurgence of other types of filings.2 The downward trend in credit crisis litigation continued in the first half of the current year, which saw the filing of only eight of these securities class actions: an annual pace of 16 such cases. This compares to 36 such filings last year, 58 in 2009, and 103 in 2008.3 Ponzi scheme litigation, spurred by the revelation of Bernard Madoff's scheme in December 2008, accounted for 36 filings in 2009 and nine in 2010, but only two so far in 2011.
The fall-off in credit crisis and Ponzi filings in the first half of 2011 vis-à-vis the second half of 2010 has been countered by an increase in "standard filings,"4 including the surge in those targeting Chinese companies. As in the second half of 2010, a large number of suits in the first half of 2011 challenged the pricing of a merger or acquisition; however, the 37 such suits filed in the first half of this year were fewer than the 50 M&A pricing objection suits filed in the second half of last year. Filings are broken down by type in Figures 1 and 2.
Figure 2 indicates that the pace of filings in the first half of 2011 was indeed unusually high. Filings in the first half of the year were higher than in any January-to-June period since 2003. If 2011 follows the pattern of the past four years, we can expect more filings in the second half of the year than in the first. As Figure 2 also shows, however, there is substantial variability in the number of filings, and patterns seen in prior filings numbers may not be indicative of trends going forward.
Filings by Circuit
The Second Circuit (which encompasses New York, Connecticut, and Vermont) had the most filings of the twelve US circuits each year from 2006 to 2009, but the Ninth Circuit (encompassing California, Washington, and certain other Western states and territories) overtook it in 2010, as we noted in our 2010 year-end update. The Ninth Circuit held its lead in the first half of 2011, with 40 cases filed as compared to the Second Circuit's 32, a 25-percent differential that was roughly in line with results for 2010, when the Ninth Circuit had 69 filings as compared to 55 in the Second Circuit. See Figure 3.
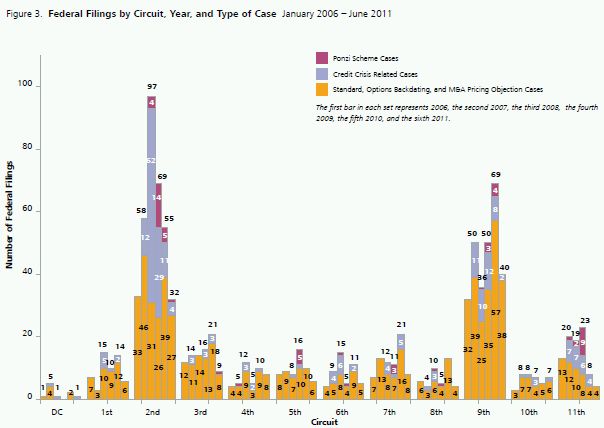
The Ninth Circuit's lead is even more pronounced if cases against Chinese-domiciled issuers are excluded, as the majority of these have been filed in the Second Circuit. The Ninth Circuit had 50 percent more filings than the Second in cases involving non-Chinese-domiciled companies.
Filings by Sector
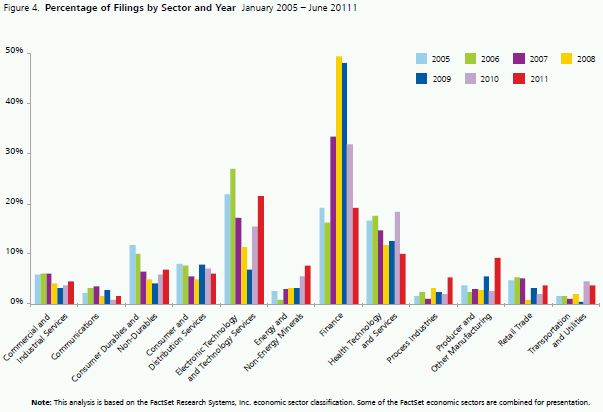
After accounting for more filings than any other industry each year from 2007 through 2010, the financial sector has fallen back to second place. During the first half of 2011, just under 20 percent of filings had a financial firm as the issuer, as compared to 22 percent that involved a company in the electronic technology and technology services sector. Cases against energy and non-energy minerals issuers rose for the fifth year in a row. The communications sector saw the fewest filings. See Figure 4.
The re-ascendance of the electronic technology and technology services sectors and of the Ninth Circuit are, of course, related developments. Only two filings involving these sectors were in the Second Circuit, while the Ninth Circuit saw nine, which is not surprising, given the concentration of technology companies on the West Coast.
Class plaintiffs won a favorable Supreme Court ruling in March 2011 in Matrixx Initiatives, Inc. v Siracusano. They alleged that Matrixx, a pharmaceutical manufacturer, failed to disclose that Zicam, a cold remedy that it manufactured, was associated with reports that some users lost their sense of smell. The Court rejected defendants' argument that this omission could not have been material because the number of Zicam users who lost their sense of smell was not statistically significant, which Matrixx argued made the evidence of a claimed connection immaterial. By endorsing an expansive view of materiality, the Matrixx decision could lead to an increase in the number and/or viability of securities class action suits against manufacturers of pharmaceuticals, medical devices, consumer goods, and other products suspected of having defects or adverse side-effects.
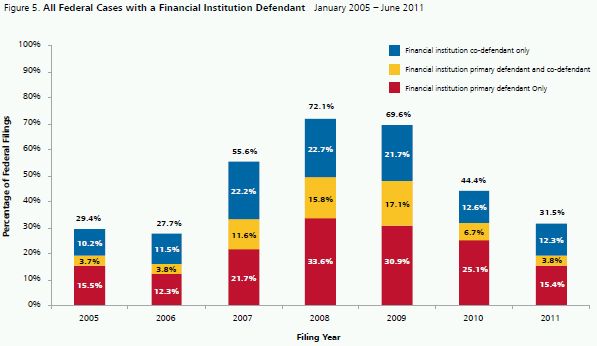
Even though the proportion of filings involving an issuer in the financial sector has declined sharply from its 2008 peak of 49 percent (see Figure 4), there was still a considerable number of such filings in the first half of 2011. At 19.2 percent, the proportion of suits against financial issuers is now more in line with its historical average. And, the involvement of financial sector companies in securities class actions is not limited to their role as issuer; often they are sued for their work as underwriters. As Figure 5 shows, in the first half of 2011, 31.5 percent of filings named a financial institution as a primary defendant and/or co-defendant. In 2008 and 2009, about 70 percent of filings had such a defendant. The current level is roughly in line with that of 2005-2006, before the credit crisis.
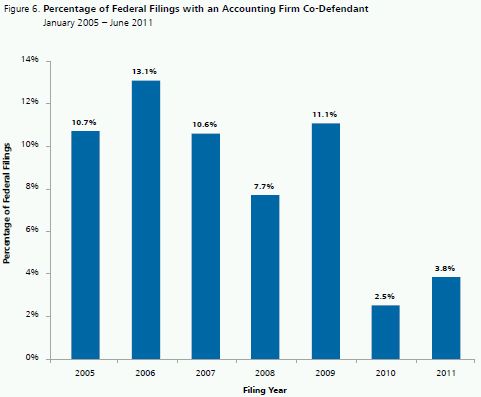
Another notable development, now in its second year, is the depressed rate of filings with an accounting firm co-defendant. Despite recovering somewhat from its 2010 low, the incidence of such cases is only 3.8 percent, much below its 7.7 - 13.1 percent levels prior to and during the credit crisis. See Figure 6. The small proportion of filings with an accounting firm co-defendant in the first half of 2011 is particularly striking given the increase (to almost 30 percent) in filings that allege accounting fraud (see below in section "Trends in Allegations"). Many of the accounting cases with no accounting firm co-defendant involve Chinese companies.
The Supreme Court's June 2011 decision in Janus Capital Group, Inc. v. First Derivative Traders limits liability for misstatements to the corporate entity that actually makes the statement. Had Janus Capital been decided differently, it might have created additional circumstances under which accounting firms could be sued in connection with misstatements about public companies, but as it is, the decision leaves undisturbed the status quo in all but one circuit (the Fourth).
Filings by Defendant's Country of Domicile
In the first half of 2011 over a third of federal securities class action lawsuits were filed against foreign-domiciled issuers. This rate is extraordinary by historical standards, more than double the prior peak in 2004. It represents a tripling of the rate that prevailed over the prior two years. In past editions of NERA's Trends study we observed that foreign companies listed in the US are less likely to be sued than domestic issuers. The first half of the year saw a sharp reversal of this pattern. Results for the first half of 2011 imply that US-listed foreign-domiciled companies are twice as likely to be sued as US-domiciled issuers.5 See Figure 7.
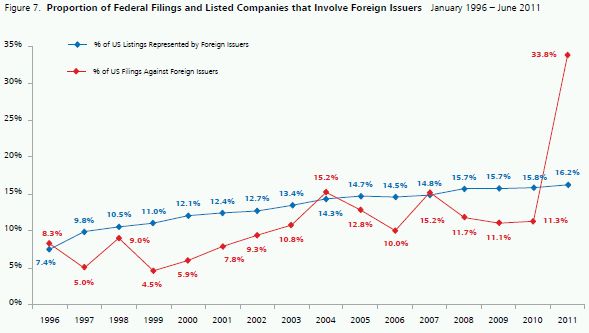
The recent increase in the incidence of filings against foreign-domiciled defendants is an especially surprising development in light of the June 2010 Supreme Court decision in Morrison v. National Australia Bank, which bars private claims under Section 10(b) of the 1934 Exchange Act for transactions in overseas markets.6 This decision was expected by many commentators to result in fewer federal securities class actions against non-US companies whose securities are primarily traded abroad, because there might be insufficient US trading to make the litigation worthwhile. However, the tendency of Morrison to reduce the incentive to sue non-US companies under any given set of circumstances has been more than offset by the rapidly growing number and changing circumstances of US-listed Chinese companies.
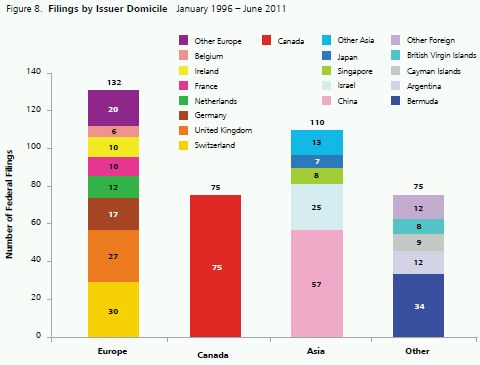
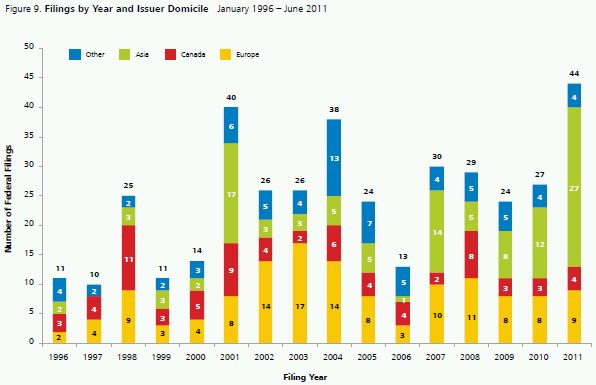
Figure 8 shows the number of filings against foreign-domiciled companies. Note that historically Canadian issuers have been targeted more often than issuers from any other country. However, this trend has reversed in 2010-2011.
In the first half of 2011, 27 suits were filed against companies domiciled in China: some 60 percent of all suits against foreign-domiciled issuers. Figure 9 shows annual federal filings against foreign-domiciled companies by year and geographic region. All filings against Asian companies in the first half of 2011 named a Chinese-domiciled issuer as a defendant.
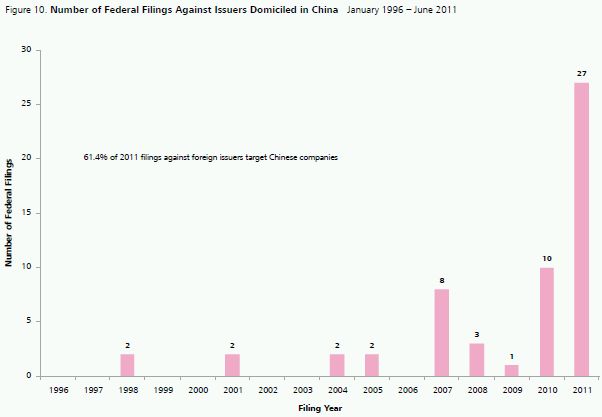
Many of the recent securities lawsuits against Chinese-domiciled companies have focused on issues relating to financial reporting, including revenues, costs, profits, and cash. Figure 10 reveals the recent emergence of such suits. Prior to 2007, which had eight such filings, there were few lawsuits involving Chinese companies. After falling back for the next two years, filings against Chinese issuers took off again in 2010 and have surged in the first six months of this year, which has produced more such filings than the prior nine years combined.
We will continue to monitor this issue to see if these types of filings proceed apace for the remainder of the year, and we will track and report on the existing suits as they proceed to resolution.
Time to File
In the first half of 2011, the speed with which cases were filed accelerated sharply relative to the end of the proposed class period, with 47 percent of suits brought within two weeks of that date, as compared to 29 percent in the previous four years. The quickened pace of filing activity in the early post-class period is unsurprising in light of the surge in M&A objection litigation, as these cases have unusual time-urgency. At the far end of the spectrum, on the other hand, activity slowed, with five percent of filings in the first-half of 2011 brought more than two years after the end of the proposed class period, as against 2 percent of prior-four-year filings. The median time to file, 21 days in the latest half-year, is down from 54 days over the previous four years. See Figure 11.
Trends in Allegations
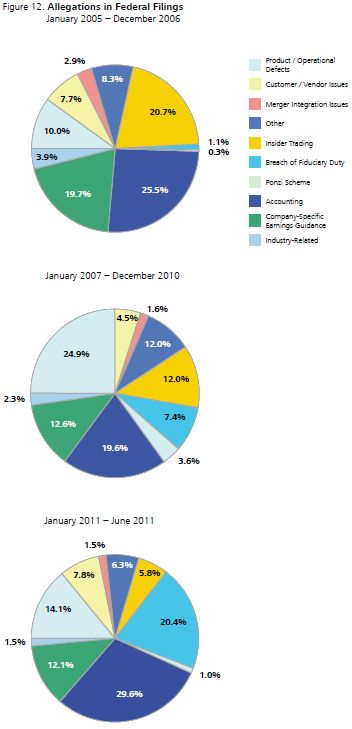
One of the most notable trend reversals in the first half of 2011 is in the proportion of filings with accounting allegations: increasing to about 30 percent after two years of decline. Many of these suits are against Chinese companies. The second most frequent allegation is breach of fiduciary duty. Approximately 20 percent of recent filings have such an allegation: up from about one percent in 2005 – 2006. This allegation is characteristic of merger objection and Ponzi scheme cases.
Vying for third place are allegations involving product and operational defects (which encompass both traditional, tangible goods and financial products) and company-specific earnings guidance, present in 14 percent and 12 percent of filings, respectively.7 In contrast to recent high-profile criminal prosecutions for insider trading—for example, of Raj Rajaratnam and others connected to the Galleon Group hedge fund—insider trading allegations in securities class actions have declined yet again and currently figure in less than 6 percent of filings. See Figure 12.
The rising share of cases with a breach of fiduciary duty allegation is largely a by-product of the growth in cases challenging the pricing of a merger or acquisition. In both 2010 and the first half of 2011, such cases accounted for almost 30 percent of filings. See Figure 1.
Associations between types of allegations and types of defendants can be instructive in understanding the factors motivating filings. For example, during 2010 and the first half of 2011, product and operational defect allegations were most apt to be present in suits against financial issuers (49 percent of those cases), underscoring that losses relating to certain financial products (e.g., mortgage securities, credit default swaps, collateralized debt obligations, and auction-rate securities) have given rise to a substantial volume of securities class action litigation. Allegations concerning company-specific earnings guidance were least prevalent in cases targeting financial issuers (8 percent) and most prevalent in those against health technology and services companies (49 percent). The proportion of cases with accounting allegations was highest for the producer manufacturing sector (83 percent) and lowest for health technology and services firms (12 percent). The likelihood that any given suit alleged breach of fiduciary duty was greatest for firms in the transportation and utilities and communications sectors (75 percent).
Filings and Volatility
We continue to monitor the link between stock market volatility and the number of filings. Historically, filing activity has correlated positively with market volatility, as measured by the annualized standard deviation of returns for the S&P 500 index.8 Figure 13 depicts the relationship.
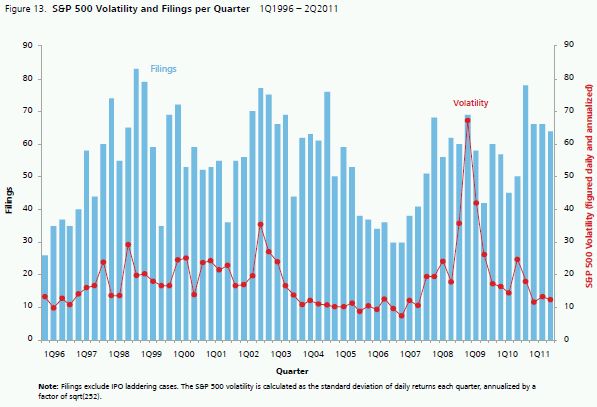
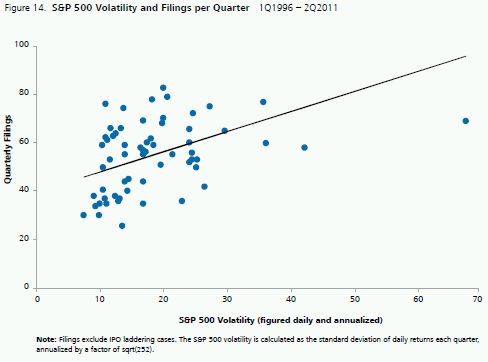
Volatility in the first half of 2011, as measured by the annualized standard deviation of daily returns, remained at roughly the same level as in the second half of 2010. It has been higher over the past four years than previously, and this has been accompanied by an increase in the overall number of filings compared to the 2005-2006 period. Statistically, the relationship between filings and volatility is stronger after incorporating the four most recent quarters of data (the second half of 2010 and the first half of 2011), and the relationship remains statistically significant. Controlling for market returns, volatility is positively and statistically significantly correlated with quarterly filings from the first quarter of 1996 through the second quarter of 2011. However, as can be seen from the scatter plot in Figure 14, the relationship between volatility and the number of filings is not one-for-one, nor is it close. Indeed, market volatility and market returns together explain only about 20 percent of the variance in quarterly filings.
TRENDS IN RESOLUTIONS
Resolution of Cases by Filing Year
Because it can take years for a case to resolve, focusing on decade-old filings allows us to see how a particular cohort of fully-resolved cases reached closure. Of the 236 cases filed in 2000, 63 percent settled and the rest were dismissed; none are pending.9 See Figure 15.
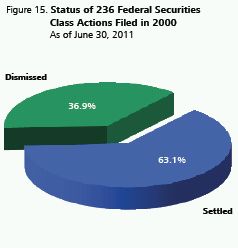
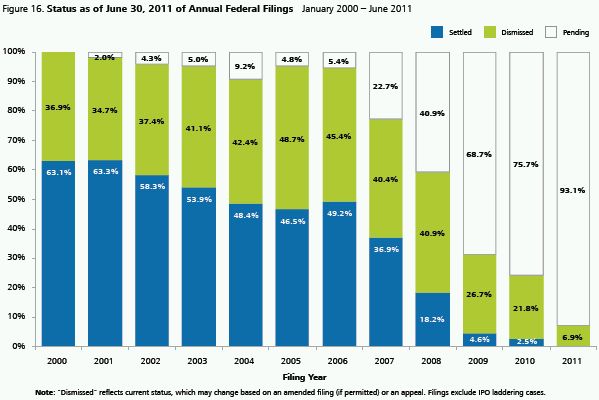
Figure 16 also shows the status of cases filed each year since 2000, indicating the percent settled, the percent dismissed (at least for now), and the percent pending. Of the cases filed last year, close to a quarter have been definitely or at least potentially resolved, with dismissals (including those without prejudice and those still appealable) outnumbering settlements almost nine to one. Of cases filed in the first half of this year, none have settled and about seven percent (nine of 130) have been at least provisionally dismissed. See Figure 16.
The higher proportion of dismissals in recently resolved cases than in older ones reflects the fact that settlement talks often do not begin in earnest until a motion to dismiss has been decided; after a ruling comes down, even an initially dismissed case may settle. Among January 2000 to June 2011 filings whose current (i.e., June 30, 2011) status is dismissed, the average time from filing to dismissal is 1.6 years. For settled cases filed during this period, the average time from filing to settlement is 4.4 years. Time to either current outcome (dismissal or settlement) ranges from 3 days to 10.2 years, averaging 3.3 years.
In June, ruling on a case against Halliburton Co., the Supreme Court held that plaintiffs need not prove loss causation to prevail on class certification in a securities class action.10 Previously, the Fifth Circuit required a showing of loss causation, whereas other circuits did not. Had the ruling gone the other way and raised the bar for class certification in all other circuits, it likely would have resulted in more and earlier dismissals. As it was, the ruling was in line with case law in all but the Fifth Circuit.
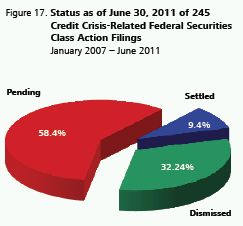
The current status of credit crisis-related cases is of particular interest to many observers. Figure 17 reveals that, as of June 30, 2011, the 245 credit crisis-related federal securities class actions filed to date have produced 79 current dismissals and only 23 settlements. While new credit crisis-related filings have dwindled, many previously filed cases remain in the pipeline.
Probability of Resolution by Age of Case
We also look at patterns of resolution by case age, measured as years from first filing. Some cases are settled or dismissed (at least provisionally) within the first year but others remain unresolved for many years. Figure 18 shows the percentage of cases filed each year from January 2000 to June 2011 that are now settled or are dismissed for all defendants.
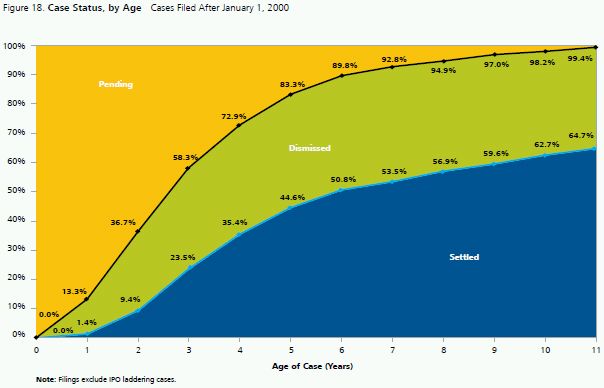
One year after filing, 1.4 percent of cases have settled and 11.9 percent are at least provisionally dismissed. At the four-year mark, settlements and such current dismissals are roughly equal, each accounting for approximately 38 percent of filings. As cases get older than that, settlements increasingly predominate. Eight years out, approximately 95 percent of cases are at least provisionally resolved one way or another.
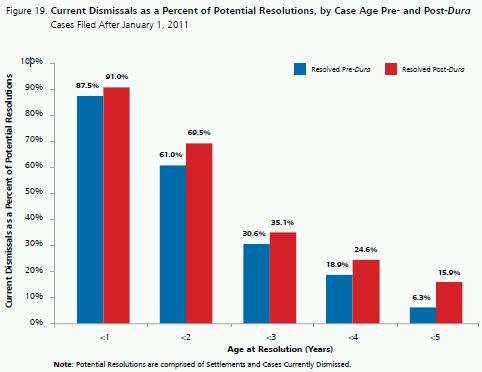
In our 2009 mid-year study we reported that cases were dismissed more often and more quickly following the US Supreme Court's decision in Dura v. Broudo in 2005 than before.11 This continues to hold true. See Figure 19.
Securities class action trials
Few federal securities class actions go to trial. Since passage of the PSLRA at the end of 1995 there have been only 29 such trials: less than one-tenth of one percent the number of filings during this period (over 3,700). Details of the cases that have gone to trial since the end of 1995 are shown in Table 1. The sole trial that occurred in the first half of 2011, In re Homestore.com, Inc., produced the eighth verdict for plaintiffs, though one of these—the November 2010 jury verdict against BankAtlantic— was set aside in an April 2011 ruling. Pure defense outcomes among the 29 trial cases number ten. The other 12 trial cases resulted in mixed verdicts, settlements during trial, or a default judgment.
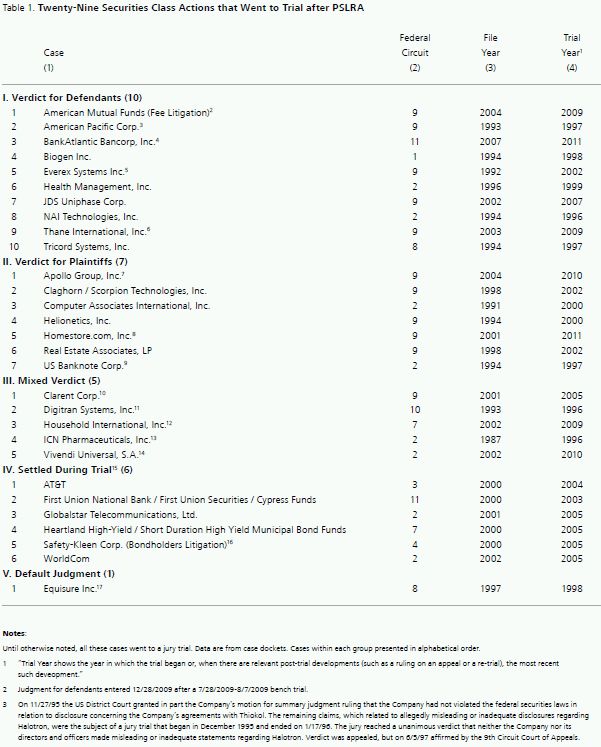
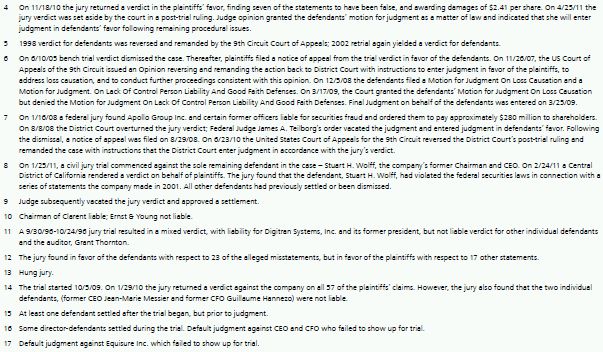
The status of the 29 shareholder class actions that have gone to trial is depicted graphically in Figure 20.
Settlements12
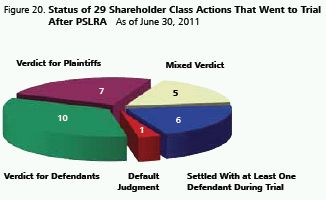
If the experience of the 2000 filings cohort remains indicative, 63 percent of cases eventually settle. In the first half of 2011, the average settlement was $23 million, sharply down from the 2010 average settlement of $108 million.13 See Figure 21.
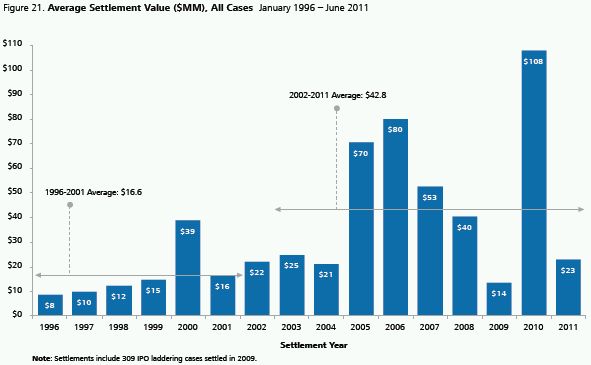
Defendants generally settle with the goal of avoiding future related litigation to the extent possible; as such, many settlements contain a provision allowing defendants to terminate the settlement agreement if there is a sufficient magnitude of claims by "opt-outs" who elect to litigate individually rather than be part of the class. Among all cases in our database that were filed and settled from January 1, 1996 through June 30, 2011 whose settlement notice we were able to locate, 21.1 percent have such a "blowup" clause. The proportion of settlements with such a provision increased from none in 1996- 1997 to nearly 32 percent in the first six months of 2011. See Figure 22.
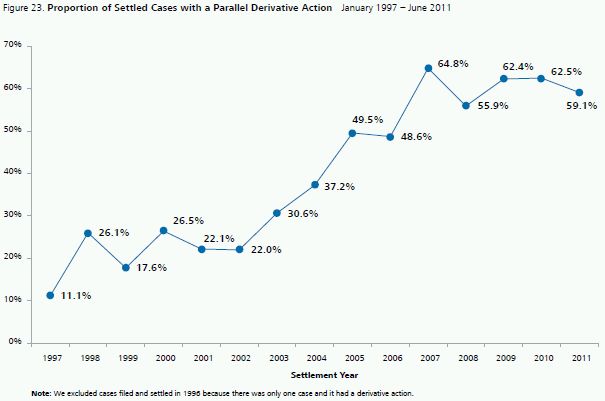
We have begun determining which of the securities class actions settlements in our database were accompanied by a parallel derivative action: a suit filed by a shareholder on behalf of the issuer against one or more directors, officers, or other third parties alleging harm from the same general conduct that is complained of in the securities class action. Among securities class actions that were filed and settled from January 1, 1996 through June 30, 2011, 42.4 percent had a parallel derivative action. For individual defendants in a securities class action, a parallel derivative action often spells increased litigation exposure. For the class action's issuer defendant, on the other hand, a derivative suit can potentially reduce total exposure by facilitating some recovery from certain individual defendants. Of course, to the extent those individuals have indemnification agreements or continue to hold board or management positions, derivative litigation may prove expensive for the issuer as well.
The fraction of settled cases accompanied by a parallel derivative action has been increasing over time. Prior to the enactment of the Sarbanes Oxley Act (SOX) in 2002, it ranged between 11 and 22 percent per year; from 2007 through the first half of 2011, the range was 56 to 65 percent. See Figure 23.
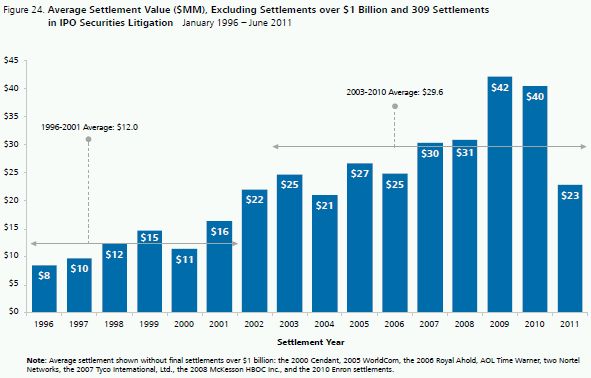
The average settlement in a given year can be influenced by an outlier observation, such as the $7.2 billion settlement in the Enron class action last year.14 Removing outlier settlements can produce a clearer read on the underlying trend in settlement size.
Figure 24 shows average settlement size by year, after excluding two types of outliers: the handful of mega-settlements beginning in 2000 that came in over $1 billion, and the 309 small settlements that were approved in 2009 for IPO laddering cases (most of them filed in 2001). There has been no outlier settlement of either type so far in 2011, making the half-year's average settlement, $23 million, unaffected by the outlier exclusions. The effect of the exclusions is to make the recent figure comparable, conceptually and size-wise, to historical norms in the years after SOX but before the credit crisis (2003 through 2006).
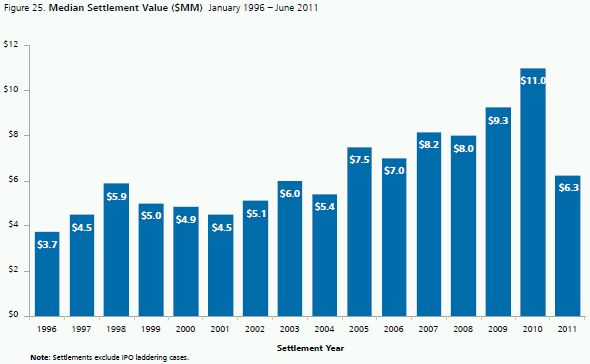
ZAnother way to track the trend in typical settlement size is to examine the median annual settlement: the level that half of all settlements exceed and half fall below. Our last year-end publication noted that the median settlement reached an all-time high of $11 million in 2010, exceeding the $10 million mark for the first time. The median settlement in the first half of 2011 plummeted to $6.3 million, less than 60 percent of the prior year's value. See Figure 25.
One reason settlements in the first half of 2011 may be low is that cases may have been more apt to settle within insurance limits, possibly due to defendants' reduced ability to pay. Of the 44 settlements in the first half of 2011, 38 were paid in cash or securities whose cash equivalent could be readily determined. We learned the contribution of insurance to 15 of these settlements from a Dow Jones Factiva news search, the settlement notice, or the issuer's SEC filings. Insurance paid all of the settlement in eight cases, between 71 and 81 percent in three, and an unspecified share in the remaining four.
Distribution of Settlements
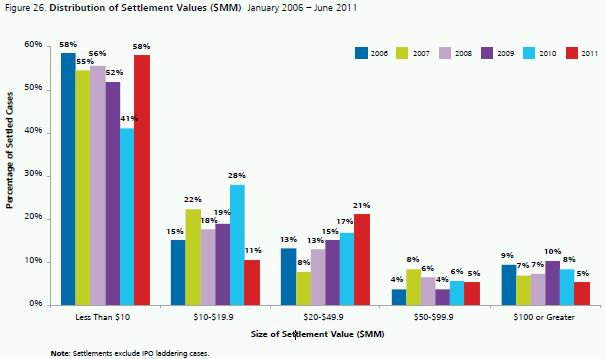
Consistent with the drop in the median settlement, the proportion of cases settling for less than $10 million reached a post-2006 high in the first half of this year. Figure 26 shows that 58 percent of cases that settled from January to June 2011 did so for less than $10 million, up from 41 percent in 2010. Only 10 percent of settlements in the first half of 2011 were for at least $50 million, down from 14 percent in the prior year.
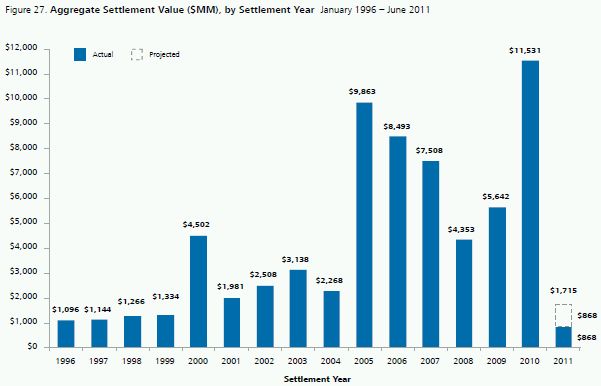
The aggregate settlement value for 2011 is projected to be $1.7 billion, which would be the first time since 2001 that aggregate settlements have fallen below $2 billion. See Figure 27. The low aggregate is due both to fewer cases settled and lower settlement size.
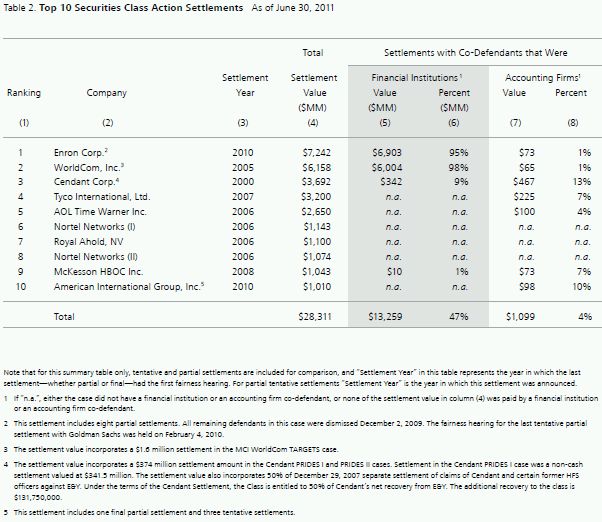
The top 10 securities class action settlements, listed in Table 2, are unchanged from what we last reported. All exceed $1 billion.
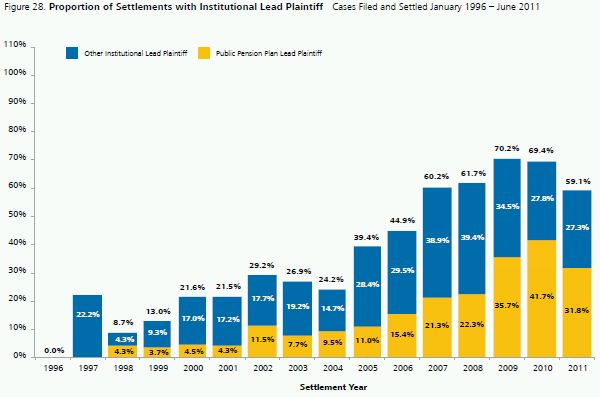
Institutional and Pension Plan Lead Plaintiff Participation
The proportion of settled cases with an institutional lead plaintiff has risen sharply since enactment of the PSLRA. See Figure 28. The same is true of settlements with a public pension plan—a particular sort of institutional investor— as lead plaintiff. No 1996 or 1997 settlement of a post-PSLRA filing had a public pension plan as lead plaintiff, but 42 percent did in 2010, as did 32 percent in the first half of 2011.
Plaintiffs' Attorneys' Fees and Expenses
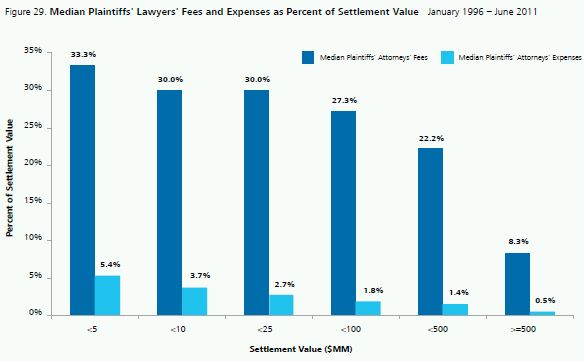
Our reported settlement values include plaintiffs' attorney fees and expenses. The median fee proportion declines from 33.3 percent on settlements under $5 million to 8.3 percent on those of at least $500 million. Median plaintiff expense ratios fall over this settlement range as well, from 5.4 percent to 0.5 percent. See Figure 29.
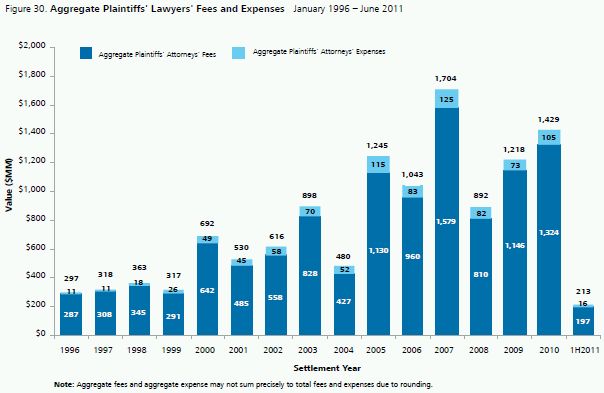
Notwithstanding the tendency of fee percentages to be high when settlement value is low, aggregate plaintiffs' attorney fees fell sharply in the first half of 2011, driven by the drop in average and median settlement size. If they continue at the current rate, aggregate fees this year will be at the lowest level since 1999.15 See Figure 30.
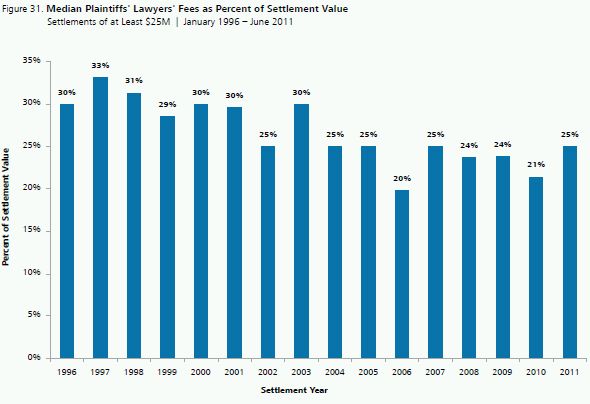
Among settlements of at least $25 million, median plaintiffs' attorney fees as a percent of settlement size trended down from the low thirties to the mid twenties in the early years following PSLRA. In eight of the past 10 years (including the first half of 2011), it has remained in the 24–25 percent range. See Figure 31.
We note a statistically significant negative relationship between the proportion of annual settlements that have a public pension plan as lead plaintiff and the median share of settlement value accounted for by plaintiffs' attorney fees. This relationship is especially strong among relatively large settlements (those above $25 million).
Investor Losses versus Settlements
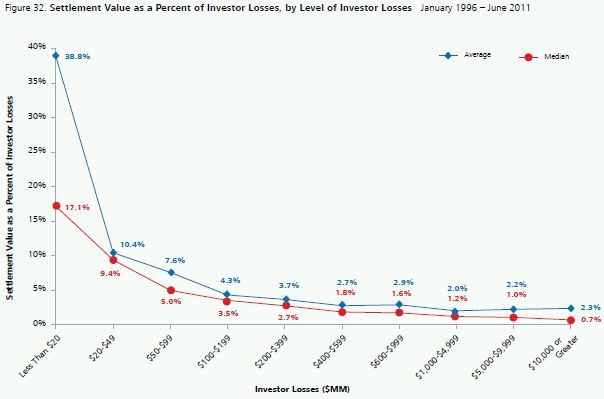
We track investor losses because historically this variable has been a reliable and powerful predictor of settlement size. Across the more than 1,000 settlements of post-PSLRA filings in our settlement database, our investor losses variable (a proxy for the difference between what investors lost from holding the stock of the issuer versus investing in the broader market) explains more than half of the variance in settlement value.16
The relationship between settlement size and investor losses is positive but not linear.17 In particular, settlement size tends to rise with investor losses but less than proportionately. The result is that small cases typically settle for a higher proportion of investor losses (i.e., more cents on the dollar) than larger cases. For example, cases with investor losses below $20 million on average settle for 39 percent of investor losses, while cases with investor losses over $1 billion settle for an average of 2 percent of investor losses. See Figure 32.
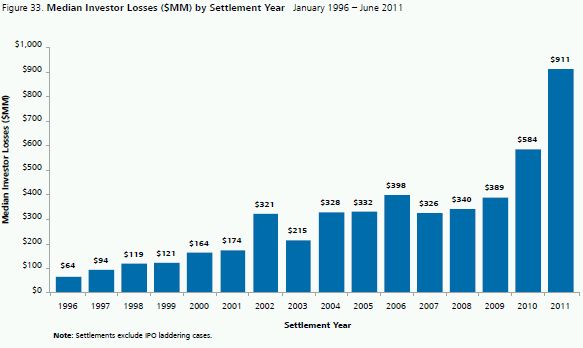
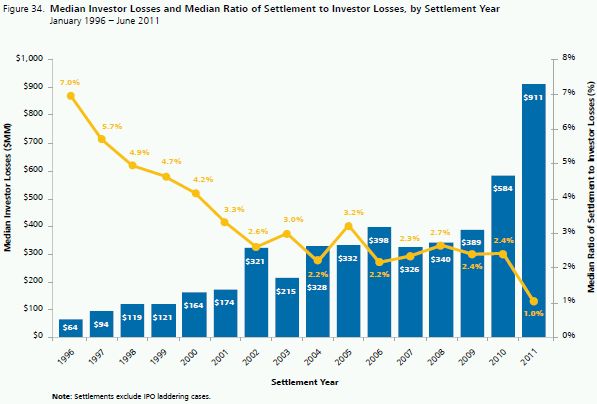
Median investor losses for settled cases have soared post-PSLRA, from $64 million for 1996 settlements to a record $911 million for cases settling in the first half of 2011. See Figure 33.
The combination of relatively low settlement values and record high investor losses has driven the median ratio of settlement to investor losses in the first half of 2011 to a record low of one percent. See Figure 34. The reduction in median settlement value is particularly noteworthy in light of the period's high investor losses, and suggests that settlements may have been depressed by the effect of the economic downturn on defendants' ability to pay.
Investor Losses for Cases Related to the Credit Crisis
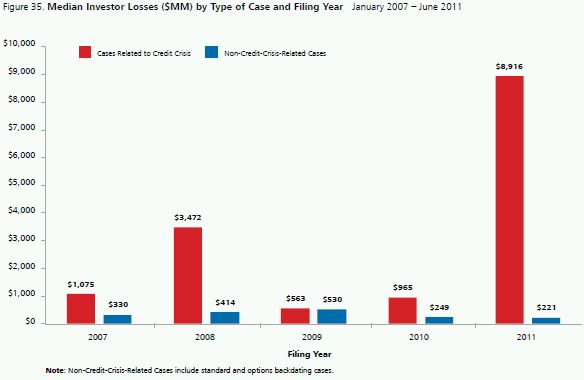
As Figure 35 shows, first-half 2011 filings for credit crisis cases had median losses more than forty times those of other filings during the period. The tendency of credit crisis cases to involve unusually large investor losses was seen in 2007 through 2010 as well, though the differentials then were not nearly as great. While the last six months of credit crisis filings have exceptionally large investor losses, their reduced share of total filings has dampened the effect of their high investor losses on median investor losses for all filings during the period.
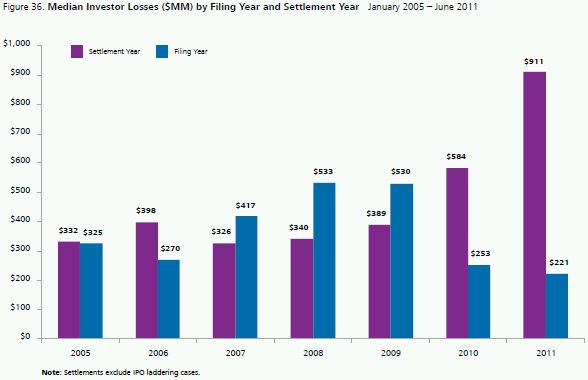
Filings and settlements generally occur in different calendar years, making it instructive to examine median investor losses by both filing year and settlement year. Because there is a strong relationship between investor losses and settlement size, as noted, investor losses of recent filings are to some extent predictive of settlement values over the years ahead.
Before the credit crisis, the median value for investor losses was consistently higher for newly settled cases than for newly filed cases. However, the credit crisis produced filings of cases that involved very high investor losses, such that in 2007, 2008 and 2009, median investor losses was higher for newly filed cases than for newly settled ones. As Figure 36 shows, the older pattern reasserted itself in 2010 and continues to hold in the first half of this year, with median investor losses once again lower for newly filed cases than for newly settled cases. This development suggests that settlement values may trend down after the as-yet-unresolved credit crisis-related cases have worked their way through the pipeline. However, if the pending credit crisis cases settle for less than their high levels of investor losses would lead one to expect (a possibility we have yet to investigate), settlement sizes could trend down even before the post-credit crisis cases begin to settle.
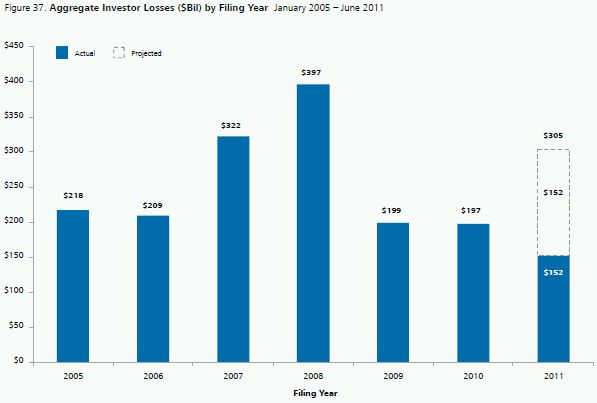
The first half of 2011 saw the filing of cases with aggregate investor losses of over $152 billion. At this rate, aggregate investor losses for 2011 filings will reach $305 billion, substantially exceeding the total for each of the prior two years and slightly above the aggregate investor losses prior to the onset of the subprime meltdown and the credit crisis (started in 2007). Based on this observation, it may be that the 2011 filings will produce a large aggregate settlement value over the years ahead. See Figure 37.
CONCLUSION
Securities class action filings in the first half of 2011 proceeded at an unusually strong first-half pace. Compared to the prior year's first six months, filings rose from 95 to 130, with an increase in merger and acquisition objection cases and cases against Chinese issuers more than offsetting the drop in credit crisis suits. On the settlement front, the period saw much less activity. With only 38 cases settling for cash and the median settlement falling below $7 million, the annualized aggregate value of all settlements was down to its 2001 level.
Footnotes
The opinions expressed herein do not necessarily represent the views of NERA Economic Consulting or any other NERA consultant. Please do not cite without explicit permission from the authors.
* This edition of NERA's research on recent trends in shareholder class action litigation expands on previous work by our colleagues Lucy Allen, Elaine Buckberg, Frederick C. Dunbar, Todd Foster, Vinita M. Juneja, Denise Neumann Martin, Ronald I. Miller, Stephanie Plancich, and David I. Tabak. We gratefully acknowledge their contribution to previous editions as well as this current version. The authors also thank Jake George, Marcia Mayer, John Montgomery, and David I. Tabak for helpful comments. In addition, we thank Stefan Boettrich, John Diamond, Nicole Roman, Sheena Siu, Carlos Soto, Leixin Zhao, and other NERA Securities and Finance Practice researchers for their valuable assistance with this paper. These individuals receive credit for improving this paper; all errors and omissions are ours.
1 Data on filings come from multiple sources, including RiskMetrics Group/Securities Class Action Services (SCAS), Dow Jones Factiva, Bloomberg Finance L.P., FactSet Research Systems, Inc. ("FactSet"), SEC filings, and the public press. In compiling our data, we seek information on all unique class actions alleging damages with regard to the purchase, ownership, or sale of securities. Most of our summary statistics below are based on data for cases filed in US federal courts. Until cases are consolidated, we report multiple filings that potentially are related to the same alleged fraud if complaints are filed in different circuits. Similarly, until cases are consolidated, we report multiple filings if different cases are filed on behalf of investors in common stock and other securities. If cases are consolidated, the data are adjusted accordingly.
2 See Dr. Jordan Milev, Robert Patton, and Svetlana Starykh, "Trends 2010 Year-End Update: Securities Class Action Filings Accelerate in Second Half of 2010; Median Settlement Value at an All-Time High," December 2010, at http://www.nera.com/nera-files/PUB_Year_End_Trends_1210.pdf.
3 Credit crisis-related class actions are those filed in or after 2007 with allegations relating to subprime mortgage loans, securities with such loans as collateral, adequacy of reserves, declines in real estate prices, the homebuilding industry, and structured products. The category also encompasses cases relating to the banking and financial crisis; these began to be filed in 2008. Also included are suits against credit rating agencies and litigation stemming from investments in auction-rate securities (ARS) and other structured products.
4 We now define "standard filings" as all filings other than (a) those with IPO laddering, mutual fund market timing, or research analyst allegations; (b) recent cases involving the credit crisis (including ARS), Ponzi schemes, or options backdating; and (c) post-2004 filings objecting to the pricing or other terms of a merger or acquisition. In previous editions of this publication, M&A pricing objection cases were counted among standard filings.
5 The proportion of all April 2011 US-listed companies (domestic or foreign) that were sued in a securities class action over the year July 2010 to June 2011 was 5.4 percent.
6 Morrison et al. v. National Australia Bank Ltd. et al., 130 S.Ct. 2869 (2010).
7 Most securities class action complaints have multiple allegations. All allegations are included in this analysis such that the total number of allegations exceeds the total number of filings.
8 See NERA Working Paper "Trends 2010 Mid-Year Study: Filings Decline as the Wave of Credit Crisis Cases Subsides, Median Settlement at Record High," by Dr. Jordan Milev, Robert Patton, Dr. Stephanie Plancich, and Svetlana Starykh, July 2009, at http://www.nera.com/nera-files/PUB_Mid_Year_Trends_0710b.pdf.
9 Our dismissal statistics include summary judgments and verdicts for defendants but not partial dismissals. For recent cases, our dismissal statistics tend to be overstated from the standpoint of eventual outcome because they include current dismissals of cases that will eventually settle (e.g., if the dismissal is without prejudice and a better-pled amended complaint is later filed, or if the dismissal is with prejudice but is successfully appealed). For older cases, our dismissal rates tend to be understated at early ages from the standpoint of contemporaneous outcome because what was a dismissal at the time may have been replaced with a settlement in our database.
10 Erica P. John Fund, Inc., FKA Archdiocese of Milwaukee Supporting Fund, Inc. v. Halliburton Co. et al., 563 U.S. ____ (2011).
11 Dura Pharmaceuticals, Inc., et al. V. Broudo et al., 544 U.S. 336 (2005).
12 Unless otherwise noted, tentative settlements (those yet to receive court approval) and partial settlements (those covering some but not all non-dismissed defendants) are not included in our settlement statistics. We define "Settlement Year" as the year of the first court hearing related to the fairness of the entire settlement or the last partial settlement.
13 Our dollar-based settlement statistics are limited to settlements that provide at least some cash or securities with a readily-determined cash value to class members. This restriction effectively excludes merger objection settlements, whose cash value typically covers plaintiffs' lawyers' fees only.
14 As described in footnote 12, we assign a settlement to the year when it was court-approved for the last settling defendant. It is on this basis that Enron is assigned to 2010.
15 Projected total fees for the year are $394 million, inclusive of fees paid to settle merger objection cases that provide no cash settlement to class members.
16 Technically, the investor losses variable explains more than half of the variance in the logarithm of settlement size. Investor losses over the class period are measured relative to the S&P 500, using a proportional decay trading model to estimate the number of affected shares of common stock. We measure investor losses only if the proposed class period is at least two days; this restriction effectively excludes merger objection cases from our investor losses statistics.
17 Figure 32 has a logarithmic scale on the horizontal axis. On this scale, a constant multiple increase in a variable spans the same distance whether the rise is from, say, $20 million to $200 million or $1 billion to $10 billion.
The content of this article is intended to provide a general guide to the subject matter. Specialist advice should be sought about your specific circumstances.