
The 2024 Global Survey of Accounting Assumptions for Defined Benefit Plans is the 35th annual WTW survey of assumptions selected by major corporations for their defined benefit (DB) plans around the world.
In broad terms, accounting standards aim to enable employers to approximate the cost of an employee's pension or other postretirement benefit over that employee's service tenure. Any benefit accounting method that recognizes the cost of benefits before their payment becomes due must be based on estimates or assumptions about future events that will determine the amount and timing of benefit payments.
Two key economic assumptions in the determination of benefit costs under an accounting standard are the discount rate and inflation. Under ASC 715, there is another key economic assumption — the expected long-term rate of return on plan assets (for funded plans). In many countries, four additional economic assumptions, which are somewhat linked to inflation, can play a key role: (1) rate of salary increase; (2) rate of increase in pensions, both in deferment and in payment; (3) cash balance interest crediting rate; and (4) rate of increase in the social security parameters reflected in the pension benefit formula. We discuss these in our full report.
Although this survey mainly explores economic assumptions, we have again shown data regarding mortality assumptions, which are receiving closer attention because of increasing longevity.
The observations in this report reflect data at or near the end of 2023. Consideration should be given to market movements since December 31, 2023. As discussions around accounting assumptions start for the 2024 year-end, your WTW consultant would welcome the opportunity to discuss how that volatility might have affected your plans' liabilities and assets.
Key findings
Our full report, which represents 1,100 companies with data from 47 countries and regions, includes the following key findings:
- In 2023, there was a global decline in both corporate and government bond yields. Specifically, government bond yields decreased in 33 out of the 42 listed countries. Additionally, half of the Eurozone countries ended the year with a reduction in government bond yields exceeding 50 basis points.
- As 2023 unfolded, economic uncertainties persisted; however, the main stock markets exhibited resilience, maintaining levels close to those observed at the end of 2022. Some markets even showed modest improvements.
- Moving into 2024, while not fully recovering to previous highs, most major indices demonstrated cautious optimism in the face of ongoing global economic challenges.
- The year-on-year changes of expected rates of return assumptions have remained fairly stable, ranging from –28 bps to +58 bps.
Discount rates
Discount rates are used to calculate benefit obligations, and the service and interest cost portion of the employee benefit cost.
While ASC 715 does not explicitly define the quality of the bond yields, most plan sponsors base their discount rate on AA-rated bonds. IAS 19 refers to high-quality corporate bond yields, which is generally interpreted to mean AA-rated or better. The primary focus for corporations has been placed on long-term, high-quality corporate bonds of appropriate duration consistent with the benefit obligation.
Where there is no deep market in corporate bonds, it is customary for ASC 715 discount rates to be based on government bonds but adjusted by some level of risk premium to approximate corporate bond yields.
By contrast, IAS 19 requires the use of government bonds with no additional risk premium in such situations; therefore, we present discount rates for both accounting standards separately.
Figure 1 shows the average discount rates for benefit obligations at the end of 2023 and 2022, using ASC 715 and IAS 19. These tables include values for companies with December 31 balance sheet dates only. Our survey results for major economies reveal a reversal in the 2023 discount rate upward-trend, with the exception of Japan.
Figure 1: Discount rates for benefit obligations — averages
|
For the purposes of this table, 2024 represents the discount rate assumption used for benefit obligations at the end of 2023 |
||||
|
Averages — ASC 715 |
Averages — IAS 19 |
|||
|
2024 |
2023 |
2024 |
2023 |
|
|
Canada |
4.81% |
5.10% |
4.69% |
5.06% |
|
Germany |
3.39% |
3.74% |
3.36% |
3.66% |
|
Japan |
1.75% |
1.56% |
1.69% |
1.52% |
|
Netherlands |
3.35% |
3.67% |
3.47% |
3.64% |
|
Switzerland |
1.43% |
2.13% |
1.45% |
2.13% |
|
United Kingdom |
4.62% |
4.85% |
4.64% |
4.79% |
|
United States |
5.21% |
5.52% |
5.09% |
5.36% |
For countries with a deep market in corporate bonds, it has become increasingly common to match expected cash flows from the plan either to a portfolio of bonds that generates sufficient cash flows or to a notional yield curve generated from available bond information. This is a common approach in Canada, the Eurozone, Japan, the U.K. and the U.S. and is becoming more common in Australia, Norway, Sweden and Switzerland.
Inflation
The assumption for long-term price inflation influences other economic assumptions such as:
- Rate of salary increase
- Rate of increase in pensions, both in deferment and in payment
- Rate of increase in the social security parameters reflected in the pension benefit formula
- Cash balance interest crediting rate for some plans
Figure 2 shows the average inflation assumption for the 2024 and 2023 expense. For some developing countries, inflation has historically been very volatile, which has led some companies to select assumptions on a real basis (i.e., net of inflation). Contrary to the previous year, inflation rates have been overall diminished in line with monetary policies adjustments, except in Japan and Switzerland. In the U.K. and Eurozone countries, inflation curves are often used to derive a plan's inflation assumption.
Figure 2: Inflation assumptions - averages
|
Figure 2: Inflation assumptions - averages |
||
|
2024 |
2023 |
|
|
Canada |
2.04% |
2.05% |
|
Germany |
2.24% |
2.28% |
|
Japan |
1.37% |
1.33% |
|
Netherlands |
2.23% |
2.31% |
|
Switzerland |
1.25% |
1.19% |
|
United Kingdom* |
3.16% |
3.30% |
|
United States |
2.69% |
2.72% |
*Retail price index
Expected rates of return
The expected rate of return on assets is the long-term expectation of the annual earnings rate on the assets of the pension fund. Under ASC 715, the expected return on assets is a component of the employee benefit cost. Expected rates of return reflect the plan sponsor's outlook while considering the plan's asset allocation.
Figure 3 shows the average allocation split among equities, bonds, property, cash and insurance contracts/ other investments. The weighted average of the expected long-term rate of return on each class gives an indication of the appropriate expected return on assets assumption. In comparing with results from last year's survey, we witnessed only minor changes in asset allocations across the board.
Asset allocations are likely to be driven by several factors, such as funded status, sponsor risk appetite, nature and maturity of the obligations, and local regulations. The complete results show that sponsors in Australia, Hong Kong SAR and New Zealand are holding relatively large equity positions (more than 45%). Brazil, India, Indonesia, Mexico and Taiwan are countries where regulatory investment restrictions influence their asset mix.
Figure 3. Average asset allocation by country
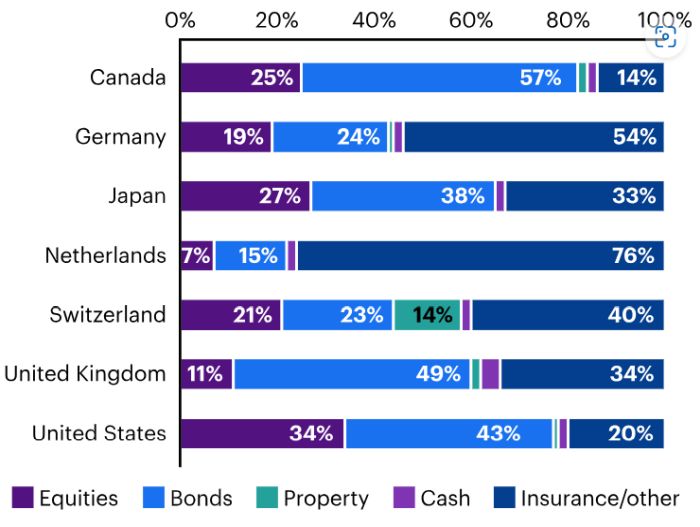
Figure 3. Average asset allocation by country
Figure 4 shows the average expected rates of return for 2024 and 2023 expense for all plans reported under ASC 715 only. The year-on-year changes of expected rates of return assumptions vary even within developed countries both in direction and magnitude of change. High levels of uncertainty regarding both the fixed-income and equity markets, paired with the uncertainty of how inflation may react to monetary policy, may be the drivers behind these results. As expected, there is a positive correlation between expected rate of return and the amount of plan assets held in equities by plan sponsors.
Figure 4. Expected rates of return — averages
|
Figure 4. Expected rates of return — averages |
||
|
2024 |
2023 |
|
|
Canada |
5.25% |
5.17% |
|
Germany |
4.40% |
4.15% |
|
Japan |
2.98% |
2.75% |
|
Netherlands |
3.84% |
3.61% |
|
Switzerland |
3.59% |
3.83% |
|
United Kingdom |
5.19% |
4.91% |
|
United States |
6.23% |
6.23% |
Mortality tables
Figure 5 shows the assumed life expectancy at age 60 for both a male currently age 60 and a male currently age 40. Note that some tables are generational, while others are static. The latter do not include an allowance for improvement in life expectancy for future employee cohorts; thus, life expectancy at age 60 is the same for a male currently age 60 and a male currently age 40.
The majority of surveyed countries have implied life expectancies of between 20 and 30 years. The impact of the differences in this assumption will vary depending on the payment election assumption between lump sum and annuity, the form of the annuity and the mix of current plan participants, among other factors.
Figure 5. Life expectancy of a 60-year-old male
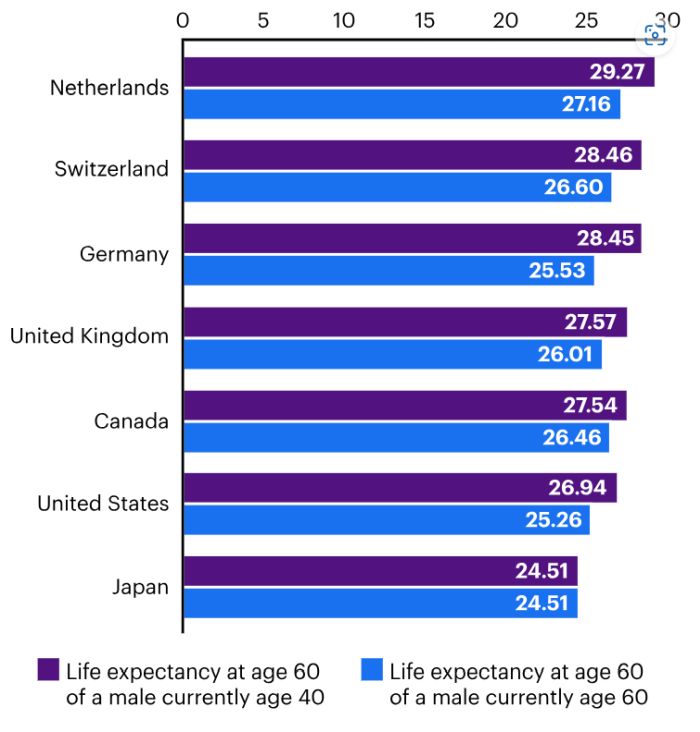
Figure 5. Life expectancy of a 60-year-old male
Projected benefit security ratio
The projected benefit security ratio is the ratio of the current market value of plan assets to the plan's projected benefit obligation. The projected benefit obligation is the actuarial present value of all benefits attributed by the benefit formula to service before the balance sheet date, including benefits based on expected future salary increases. Under IAS 19, this is known as the defined benefit obligation.
Figure 6 shows the average projected benefit security ratio for 2024 and 2023, for funded plans in each country. As detailed in the table below, most major economies experienced a decrease in their ratios, mostly attributed to lower discount rates, despite the overall positive equity market performance. In the comprehensive report where 30 countries are analyzed, changes in PBOs showed nearly equal proportions of increases and decreases in their ratios over the course of the year.
Figure 6: Projected benefit security ratio — averages
|
Table caption: Figure 6. Projected benefit security ratio — averages |
||
|
2024 |
2023 |
|
|
Canada |
1.11 |
1.14 |
|
Germany |
0.70 |
0.67 |
|
Japan |
1.18 |
1.09 |
|
Netherlands |
0.96 |
0.97 |
|
Switzerland |
0.93 |
0.99 |
|
United Kingdom |
1.13 |
1.17 |
|
United States |
0.96 |
0.97 |
About the survey
The 2024 Global Survey of Accounting Assumptions for Defined Benefit Plans is the 35th annual WTW survey of assumptions selected by major corporations for their DB plans around the world.
The full report covers accounting assumptions under various global standards; for this report, 53% of the survey participants report under ASC 715 and 47% under IAS 19 or other similar accounting standards. This is similar to the mix of participants last year.
We collected retirement plan data using a survey form and various WTW databases that maintain accounting assumptions. Results in the full report are shown on a plan-level basis; therefore, some results could differ from what is reported on a company level.
The 1,100 companies included in the full report have disclosed assumptions for their DB plans. The report reflects data at or near the end of 2023. While this executive summary covers only Canada, Germany, Japan, the Netherlands, Switzerland, the United Kingdom and the United States, the following 47 countries are represented in the full report:
|
|
*Hong Kong is a special administrative region of China
**Puerto Rico is an unincorporated territory of the United States
The content of this article is intended to provide a general guide to the subject matter. Specialist advice should be sought about your specific circumstances.