


Background
We analyzed the terms of 191 venture financings closed in the first quarter of 2017 by companies headquartered in Silicon Valley.
Overview of Fenwick & West Results
Venture valuations showed small improvements in 1Q17 compared to the prior quarter and valuation metrics are now generally flat with their 13 year averages after having fallen from all-time highs in mid-2015.
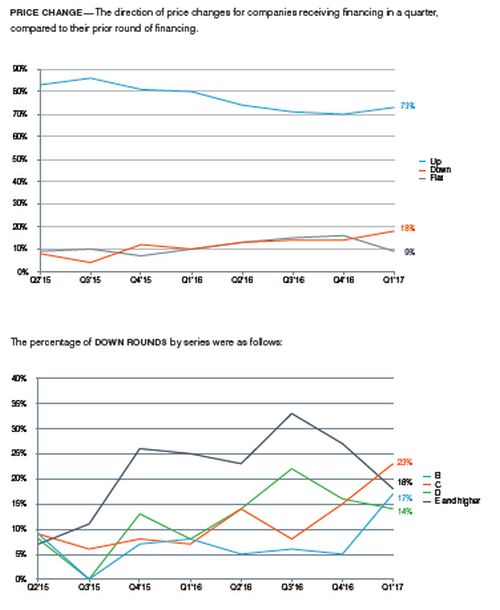
- Up rounds exceeded down rounds 73% to 18%, with 9% flat. Both the percentage of up rounds and the percentage of down rounds increased from 4Q16 when up rounds exceeded down rounds 70% to 14%, with 16% flat.
- The Fenwick & West Venture Capital Barometer" showed an average price increase in 1Q17 of 54%, a slight increase from the 51% recorded in 4Q16 and below the historical average of 56%. The average price increase for Series B and C rounds declined from 107% and 41% in 4Q16 to 75% and 35% in 1Q17, while the average price increase for Series D and E+ rounds increased from 16% and -1% in 4Q16 to 45% and 60% in 1Q17.
- The median price increase of financings in 1Q17 was 29%, which represented a small increase from the 27% in 4Q16 after previously having declined for 6 straight quarters.
- The hardware and "other"1 industries recorded the strongest valuation results in 1Q17, with the Barometer increasing from 50% and -5% in 4Q16 to 81% and 69% in 1Q17 and the median price increase increasing from 0% and 0% in 4Q16 to 38% and 59% in 1Q17. The life sciences and software industries both recorded weakening valuation results in 1Q17, with the average and median price increases declining and the number of down rounds increasing in 1Q17. The internet/digital media industry recorded a higher average price increase in 1Q17, but the median price increase declined and the number of down rounds increased in 1Q17.
- The use of investor-favorable deal terms, including multiple liquidation preferences, participation rights and cumulative dividends, increased in 1Q17.
Overview of Other Industry Data
The U.S. venture environment improved marginally in 1Q17 compared to 4Q16, but remain well below peak levels of the past few years.
- 1Q17 saw an uptick in the amount of capital invested compared to 4Q1, but the pace of investments was flat.
- While the number of venture-backed U.S. IPOs declined slightly in 1Q17 from 4Q16, the amount raised in the quarter from these IPOs was the highest total since 2Q12.
- The number of acquisitions of U.S. venture-backed companies declined in 1Q17 after a spike in U.S. M&A activity in 2016; however, the overall value of the M&A deals in 1Q17 was relatively unchanged from 4Q16.
- Although down from the same period last year, venture capital fundraising remained strong in 1Q17 notwithstanding the absence of mega-funds that closed in the quarter.
- Venture capitalist sentiment improved marginally in 1Q17 from 4Q16, and remains above the 13-year average.
Venture Capital Investment
U.S. venture capital investment activity in 1Q17 saw an uptick in dollars invested from 4Q16, but the pace of investments was relatively unchanged. While investment activity in 1Q17 was significantly lower than peak levels over the past few years, it is in line with historical norms and indicates a return to a more healthy and disciplined level of investment activity.
A summary of results published by three leading providers of venture data is below.
Comparison between 1Q17 and 4Q16:
| Down Rounds | 1Q17 ($Billions) | 4Q16 ($Billions) | Difference % | 1Q17 Deals | 4Q16 Deals | Difference % |
| VentureSource 1 | $14.5 | $10.6 | 37% | 1,032 | 868 | 19% |
| PitchBook-NVCA 2 | $16.5 | $14.3 | 16% | 1,808 | 1,898 | -5% |
| MoneyTree 3 | $13.9 | $12.0 | 15% | 1,104 | 1,085 | 2% |
| Average | $15.0 | $12.3 | 22% | 1,315 | 1,284 | 2% |
Comparison between 1Q17 and 1Q16:
| Down Rounds | 1Q17 ($Billions) | 1Q16 ($Billions) | Difference % | 1Q17 Deals | 1Q16 Deals | Difference % |
| VentureSource | $14.5 | $13.6 | 7% | 1,032 | 989 | 4% |
| PitchBook-NVCA | $16.5 | $18.7 | -12% | 1,808 | 2,383 | -24% |
| MoneyTree | $13.9 | $15.7 | -12% | 1,104 | 1,301 | -15% |
| Average | $15.0 | $16.0 | -6% | 1,315 | 1,558 | -16% |
According to Pitchbook-NVCA, and coming amid anticipation of increased exit activity, late stage venture capital investment activity increased during 1Q17 with $9.4 billion invested across 432 financings compared to $7.4 billion invested across 375 financings in 4Q16. Meanwhile, seed and early stage investment activity saw the greatest decline in the number of financings, although
the amount invested was flat. Similarly, MoneyTree noted that later stage investment deal share climbed to an eight quarter high of 11% in 1Q17, while early stage and seed stage investment deals share fell to an eight quarter low of 24% and 25%. In contrast, VentureSource reported an increase in seed round investment deal share from 6% in 4Q16 to 10% in 1Q17. In addition, of the 191 venture financings closed in 1Q17 that we analyzed, 29% were Series A financings, the highest percentage since we began the survey in 2004, and 18% were Series B financings, the lowest percentage since 2Q12. The percentages of Series C, D and E+ financings in 1Q17 were relatively unchanged from 4Q16.
Investments into information technology and consumer services declined in 1Q17, comprising 32% and 19% of the total number of financings and 23% and 16% of the invested capital in 1Q17 according to VentureSource, down from 36% and 20% of the total number of financings and 27% and 25% of the invested capital in 4Q16. Healthcare allocation trended up from 21% of the total number of financings and 24% of the invested capital in 4Q16 to 24% of the total number of financings and 36% of the invested capital in 1Q17. MoneyTree similarly reported a rise in healthcare financing deal share from 12% in 4Q16 to 17% in 1Q17, a two-year high, while internet financing deal share fell from 46% in 4Q16 to a two-year low of 44% in 1Q17. Additionally, life sciences investment activity in terms of overall deal percentage approached a seven-year high in 1Q17 according to Pitchbook-NVCA.
IPO Activity
There were 7 venture-backed U.S. IPOs in 1Q17 according to VentureSource. While this represented a small decline from the 8 venture-backed IPOs in 4Q16, the amount raised increased substantially from $694 million raised in 4Q16 to $4 billion raised in 1Q17, which was the highest total since 2Q12. The large increase in the amount raised was driven by technology IPOs, including the $3.4 billion IPO of Snap, which was one of the largest IPOs of the past five years. In contrast, life sciences companies continued to experience a slowdown in IPO activity after peaking in 2014. After a disappointing IPO market in 2016, the over 12% rise in the Nasdaq from November 9, 2016 to the end of 1Q17 and the strong performance of 2016 IPO stocks provide a positive backdrop for IPOs in 2017.
Merger and Acquisition Activity
U.S. M&A deal volume decreased in 1Q17, with VentureSource reporting a decline in the number of acquisitions of U.S. venture-backed companies from 203 in 4Q16 to 154 in 1Q17, although the overall value of the deals was relatively unchanged. The number of acquisitions of U.S. venture- backed companies in 1Q17 represents a return to 2014-2015 levels after a spike in U.S. M&A activity in 2016. Meanwhile, the $151 million average deal value in 1Q17, in large part attributable to the $3.7 billion acquisition of AppDynamics by Cisco Systems, reflects the trend over the past few years towards larger deals. Acquisitions of IT companies continued to lead the way, constituting 37% of the total number of deals and 39% of the overall value of the deals in 1Q17. Given the sizable cash hordes of public technology companies, the technology industry should continue to see high M&A rates despite the higher valuations.
Venture Capital Fundraising
Venture capitalists raised $7.9 billion in 1Q17 according to the Pitchbook-NVCA VentureMonitor, an increase from the $7.2 billion raised in 4Q16, but down from the $10.3 billion raised in 1Q16.
The number of funds closed declined to 58 in 1Q17 from 66 in 4Q16 and 70 in 1Q16, although the nine first-time funds closed during 1Q17 was the most in the last five quarters. There was a notable absence of mega-funds (fund size of more than $1 billion) that closed in 1Q17 after a number of prominent VCs raised mega-funds in 2016, with only two of the 58 funds that closed in 1Q17 valued at more than $500 million and none valued at more than $1 billion. At the other end of the spectrum, the number of microfunds (fund size of less than $50 million) that closed in 1Q17 also declined. The strong fundraising numbers in 1Q17 bodes well for VC fundraising activity during the remainder of 2017; however, the limited number of established VCs still on tap to raise large funds likely means less money overall will be raised in 2017 than in 2016.
Venture Capital Sentiment
The Silicon Valley Venture Capitalists Confidence Index® by Professor Mark Cannice at the University of San Francisco reported a slight improvement in the confidence level of Silicon Valley venture capitalists from 3.81 (on a 5 point scale, with 5 indicating high confidence and 1 indicating low confidence) registered in 4Q16 to 3.83 registered in 1Q17. Although VC confidence was little changed from the prior quarter, and remains above the 13-year average of 3.72, the issues emphasized in 1Q17 shifted from the macro issues that were the focus in 4Q16, particularly political uncertainty related to the U.S. election and various international issues, to more traditional venture issues, such as the rate of innovation, new market opportunities, and better exit expectations.
Fenwick & West Data on Valuation
To view the full article click here
Footnotes
1 Consists primarily of venture-backed food, personal care and alternative energy companies.
Table footnotes
1 Dow Jones VentureSource ("VentureSource")
2 PitchBook-NVCA Venture Monitor ("Pitchbook-NVCA")
3 PwC/CB Insights MoneyTree" Report ("MoneyTree")
The content of this article is intended to provide a general guide to the subject matter. Specialist advice should be sought about your specific circumstances.