
- within Litigation, Mediation & Arbitration, Employment and HR and Real Estate and Construction topic(s)
- with Senior Company Executives and HR
- with readers working within the Insurance industries
In our annual review of asbestos-related liabilities reported in companies' SEC filings, we find that from 2010 to 2011, average payments per resolved claim increased 75%. Although this increase in dollars per resolved claim may at first appear to be a dramatic adverse event for defendants, our further review of the underlying data suggests that this increase in payments per claim is not due to a significant upward trend in asbestos liabilities. Instead, we find that this increase can be explained by a change in the claim disease mix.
Specifically, we find that the increase in average resolution values per claim is not matched by a comparable increase in total spending—total indemnity payments are up only 15%. We find that along with this relatively modest increase in total indemnity, there has been a 30% decline in the number of resolved claims in 2011. The modest increase in aggregate asbestos liabilities along with a larger decrease in resolutions suggests that this dramatic increase in payment per claim is likely to be the result of a shifting disease mix, with malignancies making up a larger fraction of resolved claims, as fewer non-malignant claims are filed and more pending non-malignant mass filings have been cleared out of companies' backlogs.
Compared to the 75% increase in payment per resolved claims in 2011, no such dramatic trend has occurred in filings—instead, filings have stabilized over the past five years. Similarly, there is no dramatic new trend in reserve amounts in 2011.
Methodology
Using publicly available data, we analyzed trends in asbestos-related liabilities for more than 150 companies. This study represents our fourth annual assessment of these data, and extends our analysis one year, covering the period 2001 through 2011.
To analyze these trends, we compiled data from over 150 companies' Form 10-K filings with the SEC, from 2001 through 2011. We tracked five key metrics2:
- total indemnity paid: the aggregate amount a company pays to resolve claims each year;
- number of claims resolved: how many claims a company closes each year either by settling or dismissing;
- average settlement paid per resolved claim: the total indemnity paid divided by the number of claims closed each year;
- percent of claims dismissed: the fraction of claims a company closes without payment; and
- annual filings: the number of new claims a company receives each year.
In addition, for those firms reporting asbestos-related reserves, we also tracked the average reserve amount.
Average Dollars per Resolved Claim Increased 75% in 2011
- The most notable change over the past year was a 75% increase in average dollars paid per resolved claim (i.e., total payments divided by claims both settled and dismissed). The percent change in average dollars per resolved claim was calculated as an average of the percent changes for each individual company. This year's increase is greater than any other year-to-year increase in the last 10 years.
- The 75% increase in 2011 follows a 31% increase in 2010 and places the average dollars paid per resolved claim at a level almost three times the level in 2001 and two times the historical peak in 2004.
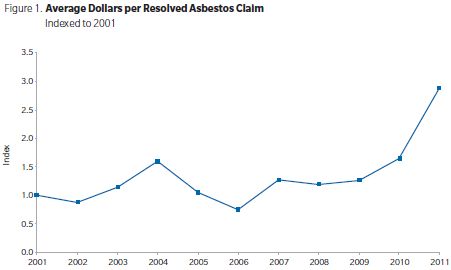
- Even weighting the percent change in average dollars for each company by the number of claims resolved, we find that average dollars per resolved claim increased by almost 50% in 2011, from $6,500 per claim in 2010 to $9,600 per claim in 2011.
- The recent increase swamps the historical variability in average resolution values, in which average dollars paid per resolved claim had increased and then decreased in a sawtooth pattern, with annual changes either up or down of more than 30%.
Total Indemnity Payments Rose 15% in 2011
- In 2011, total indemnity payments increased 15% over 2010 levels, pushing above the range held over the past six years, but remaining below the 2004 peak.
- From 2005 through 2010, total indemnity payments ranged between 1.5 and 2.0 times 2001 levels, without any upward or downward trend, moving on average 16% each year.
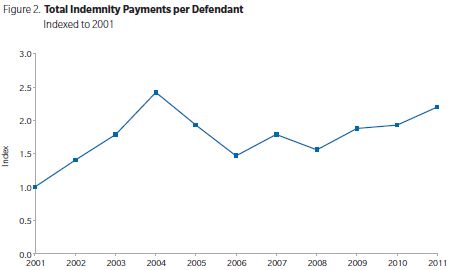
- Although the increase in 2011 represents the third consecutive year of increasing payments, average total payments have been variable historically, and the increases over the past several years have been consistent with the historical variability.
The Average Number of Resolved Claims Dropped Over 30% in 2011
- The average number of claims resolved dropped by 31% in 2011, following a similar decline in 2010, and reaching the lowest level since 2001.
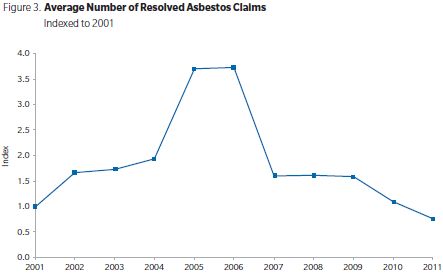
- Claims are not typically resolved in the year filed. Therefore, the claims resolved in 2011 reflect claims filed in years prior to the resolution date. As we noted in previous updates, filings began dropping mid-decade. The current pace of resolutions likely reflects the lower levels of filings during the second half of the decade.
Dismissal Rates Have Continued to Decline
- 2011 marked the third year in which the dismissal rates continued to fall, with a decline of 5% this past year.
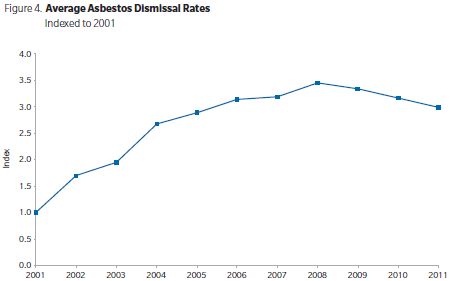
- In our previous updates, we noted that the increase in dismissal rates coincided with changes in the litigation environment, e.g., tort reforms/increased scrutiny for non-malignant claims by the courts and bankruptcy trusts, which reduced the likelihood that non-malignant claims would be paid. As such, the increasing dismissal rates through the mid-decade were likely driven by the dismissal of non-malignant claims.
- The recent declines in dismissal rates are similarly likely driven by resolutions that are more heavily weighted toward malignant filings (which have been less affected by tort reforms), as companies have cleared out their backlogs of non-malignant claims. As evidence that backlogs have been declining, the average number of pending claims peaked in 2003/2004 and has been falling since.
Average Claim Filings Have Stabilized at 20% of 2001 Filings
- Since 2007, filings have been fairly stable, hovering around 20% of the 2001 level.
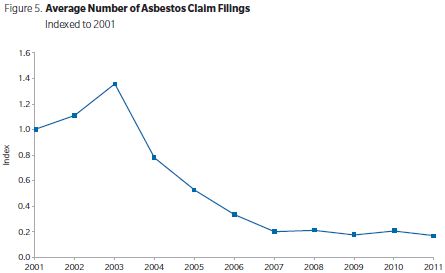
- As we have discussed in our previous studies, the mid-decade
drop in filings followed the enactment of legislative and judicial
tort reforms in multiple jurisdictions and the tightening of
medical documentation requirements by several trusts.
- Most companies included in this report did not report malignant versus non-malignant filings in their 10-Ks, but given the changes in the litigation environment, the drop in filings likely represents a drop in non-malignant filings.
- Anecdotally, in our review of detailed claims data for a number
of defendants, we have observed a decline in non-malignant filings
since the early decade highs.
- As noted above, the number of claims resolved each year has been falling over the past several years. This drop in number of claims resolved each year has followed the decline in claims filed each year, which peaked in 2004. As claims move through the system, because of the lag between filing and resolution which can be years, we would expect the number of claims resolved each year may continue to decline in the near future (mirroring the recent decline in filings, but with a lag).
- As discussed earlier, the average number of pending claims has been falling; as a result, there will be fewer, older claims (many of which were non-malignant claims) to move through the system.
So What is Behind the 75% Increase in Average Dollars Paid per Resolved Claim in 2011?
- Average dollars per resolved claim increased substantially over the past year, with a 75% increase. Is this increase in average dollars paid per resolved claim evidence of inflationary pressure on individual settlements and thereby a substantial adverse trend for defendants? We think not.
- Without information on average settlements per disease, the
public filings cannot tell us definitively:
- whether there has been upward pressure on individual settlements (in which settlements in each disease category were higher than in prior years), or
- whether there has been a shift in the disease mix of claims
resolved (in which the claims resolved comprised a greater mix of
malignant diseases than in prior years).
Each would drive up the average cost of claims but would have different implications for the price of individual settlements.
- The fact that resolution counts are down in 2011 and total
spending has increased only moderately supports the latter
explanation—that the increase in average dollars per
resolved claim is the result of a shift in the disease mix toward
malignant diseases, which have historically been more expensive to
resolve.
- Filings for non-malignant claims began dropping several years ago with tort reforms largely aimed at these types of claims.
- Because it can often take many years for the filings to work through the system, we would expect a change in the mix of resolved claims to lag that of filings. As the non-malignant claims are cleared out of backlogs (or assigned to inactive dockets), the number of claims resolved each year is expected to decline, while the mix of claims resolved is expected to become more heavily malignant. With the shift in the disease mix, average resolutions values are expected to increase.
- The drop in pending claims and the reduction in dismissal rates
are both consistent with a decline in the non-malignant
backlog.
- Our hypothesis that the recent increase in average resolution
values represents a shift in the disease mix is supported by other
information, including the experience of individual
defendants.
- One company, Honeywell, reported average settlement values for both malignant and non-malignant claims. For Honeywell, average values per resolved claim were higher in 2010 and 2011 than in prior years, but average settlement values for both cancers and non-malignant diseases in each year were below 2008 levels. For this company, the increase in average values per resolved claim over the past several years occurred because of a changing disease mix rather than upward pressure on individual settlement values.
- Anecdotally, this shift in the disease mix is also consistent with the experience of a number of defendants for whom we have reviewed individual data.
Reserve Levels Declined Slightly in 2011, Continuing a Stabilized Trend since 2004
- In 2011, average reserves declined 9%, dropping back to 2006 to 2008 levels, and the low end of the range observed since 2004, as 56% of companies decreased their reserve.
- This is the second year we reported the reserve levels across companies. As we noted in last year's update, reserve levels plateaued after large increases at the start of the decade. By 2004, asbestos reserves were on average more than three times as high as in 2001, but have remained fairly stable since then, at 2.75 to 3.25 times 2001 levels, even with the 2011 drop.3
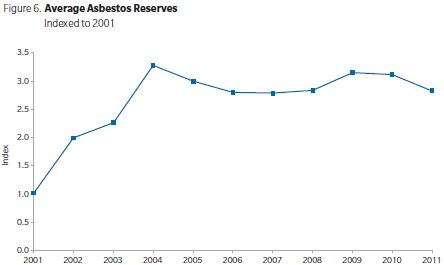
- Although we did not review data on insurer reserves, this stability in reserves may not extend to insurers. Over the past year, a number of insurers increased reserves, notably Liberty Mutual, Travelers, and The Hartford—all insurers with large asbestos liabilities.
Summary of Trends Through 2011
- Average dollars per resolved claim increased by 75% in 2011. However, this jump may not be the result of an upward trend in individual settlements. The increase in average settlements per resolved claim appears to be consistent with a reduction in the number of non-malignant claims resolved rather than upward pressure in individual settlement values. On average, resolved claims dropped and dismissal rates continued to decline—both effects consistent with a decrease in the number of non-malignant claims being resolved, as backlogs are cleared out and new filings hold constant.
- The three changes—fairly stable aggregate dollars, fewer claims resolved, and lower dismissal rates—are all patterns we would expect to see as companies resolve fewer non-malignant claims.
- Overall, the litigation appears relatively stable for defendants—total indemnity payments exhibited only a small increase this past year; filings have continued on the plateau reached in 2007, at only 20% of 2001 levels.
- However, the picture may be different for insurers who have exposure across many different companies, as a number of insurers increased reserves over the past year.
- Trends in these metrics can shift from year to year. As we collect data in the future, we can see how the pace of litigation/asbestos trusts may impact filings, resolutions, and total spending for the still solvent asbestos defendants.
Footnotes
1 The authors would like to thank Julia Nguyen for her research, Neal Fanaroff for his checking, and Stephanie Plancich for her comments and suggestions.
2 Data from the most recent Form 10-K were used whenever available. We included only data reported at the individual claim level and for companies reported at least two consecutive years in the period. The indexes reported below are an average of trends observed at the company level, and each chart may contain different companies, depending on which company reported each statistic. Data for prior years were updated if companies changed previously reported information. As a result, the graphs in the current update may differ from those in the previous update over the earlier period.
3 The index includes companies reporting at least two years of reserve data, so the initial increase when a company first started reporting a reserve is excluded.
The content of this article is intended to provide a general guide to the subject matter. Specialist advice should be sought about your specific circumstances.