

- within Government, Public Sector, Intellectual Property, Media, Telecoms, IT and Entertainment topic(s)
- with readers working within the Technology and Utilities industries
Using publicly available data, we analyzed trends in asbestos-related liabilities of more than 150 companies. This study represents our third annual assessment of these data, and extends our analysis one year to cover a full decade from 2001 through 2010.
The decade began with increasing filings, rising total indemnity payments, and mounting pending claims against defendants. By mid-decade, all three trends were reversed, with filings, in particular, falling below 2001 levels. With the close of the decade, filings and payments have stabilized for individual defendants below the mid-decade peaks, but the average claim is more expensive to resolve.
- Average claim filings remain well below 2001 levels: By 2007, average claim filings bottomed out at 20% of 2001 levels, and have remained close to this level since.
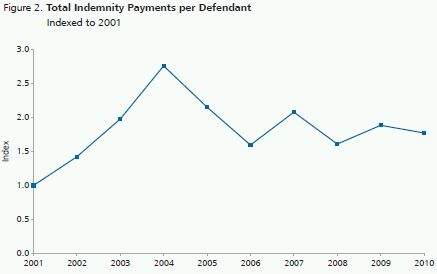
- Average aggregate indemnity payments exceed 2001 levels, but remain below the mid-decade highs: Over the past five years, average aggregate indemnity payments have ranged from 1.5 to 2 times 2001 levels, with annual volatility decreasing more recently.
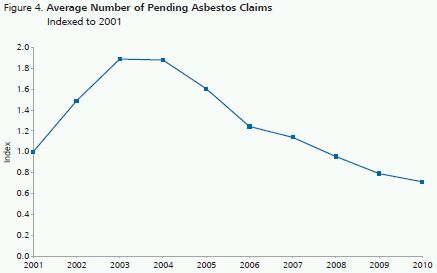
- Pending claims continue to fall: The number of pending claims continues to decline, as companies have cleared out their backlogs while filings have remained low.
The reversal of the worsening liability trends from the early 2000s followed litigation reforms at the state level—either legislative or judicial, which focused on the low quality of claims filed, particularly unimpaired non-malignant claims.1 As filing and payment trends have stabilized:
- dismissal rates, which rose steadily for most of the decade, have pulled back over the past two years; and
- average dollars per resolved claim increased for the second year, reaching almost 1.7 times 2001 averages.
The results from public filings are consistent with a shift away from non-malignant filings toward more malignant filings, and therefore may not reflect an increase in the cost of settling an individual claim, if diseases are taken into account. We have observed such a shift toward malignant filings in the detailed data for a number of defendants.
Methodology:
Compiling data from over 150 companies' Form 10-K filings with the Securities and Exchange Commission, from 2001 through 2010, we tracked five key metrics:2
- annual filings: the number of new claims a company receives each c
- total indemnity paid: the aggregate amount a company pays to resolve claims each year;
- number of claims resolved: how many claims a company closes each year either by settling or dismissing;
- percent of claims dismissed: the fraction of claims a company closes without payment; and
- average settlement paid per claim: the total indemnity paid divided by the number of claims closed each year.
In addition, for those firms reporting asbestos-related reserves, we also tracked the number of years over which reported reserves are computed and the average amount reserved.
Below we analyze each key metric separately.
Average Claim Filings Have Stabilized at 20% of 2001 Filings
- Average claim filings peaked in 2003 and then dropped steadily through 2007, declining by 85%.
- Since 2007 filings have been fairly stable, hovering around 20% of the 2001 level.
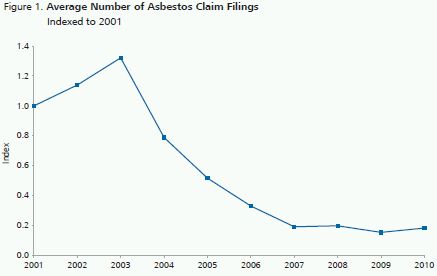
- As we have discussed previously, the drop in filings followed the enactment of legislative and judicial tort reforms in multiple jurisdictions and the tightening of medical documentation requirements by several trusts. Most companies included in this report did not report malignant versus non-malignant filings in their 10-Ks, but given the changes in the litigation environment, the drop in filings likely represents a drop in non-malignant filings. In our review of detailed claims data for a number of defendants, we have observed a drop in non-malignant filings since the early decade highs.
Total Indemnity Payments Have Stabilized at 1.5 to 2.0 Times 2001 Levels, and Annual Volatility Appears to Have Lessened
- Total indemnity payments reached a high in 2004 of almost 3 times 2001 levels, before dropping back to 1.5 times 2001 levels in 2006, and were quite volatile during this period rising or falling on average 34% each year.
- After the dramatic run up and run down in the first half of the decade, indemnity payments began to follow a saw tooth pattern, bouncing between approximately 1.5 and 2.0 times 2001 levels.
- But even this volatility appears to be lessening over the recent period. The rise in 2009 and subsequent drop in 2010 were smaller than in prior years.
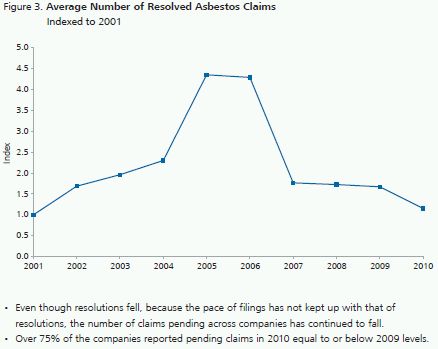
Coinciding with the Slower Pace of Filings, the Average Number of Resolved Claims Fell in 2010, while the Average Number of Claims Pending Continued to Drop
- Resolutions spiked mid-decade, reaching a high of almost 4.5 times as many as in 2001, but quickly dropped back two years later.
- After being fairly constant over the 2007 through 2009 period, the average number of claims resolved in 2010 dropped by 31%.
- The average number of claims resolved in 2010 was similar to the average number resolved at the start of the decade.
Dismissal Rates Have Ended their Almost Decade-Long Rise
- Dismissal rates in 2008 were almost 3 times the rates in 2001, but the steady increase in dismissal rates appears to have ended.
- Dismissal rates fell in both 2009 and 2010, but still, on average, remain more than 2.5 times as high as rates in 2001.
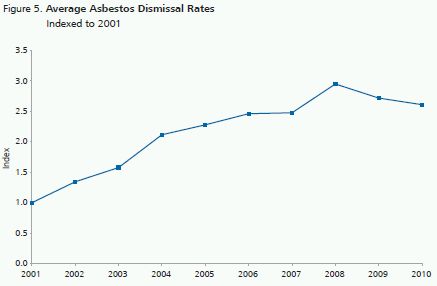
- As we noted in our last update, the increase in dismissal rates coincided with changes in the litigation environment, e.g., tort reforms/increased scrutiny for non-malignant claims by the courts and bankruptcy trusts, which reduced the likelihood that non-malignant claims would be paid. As such, the higher dismissal rates were likely driven by the dismissal of non-malignant claims.
- In our 2010 update, we had projected that dismissal rates might continue to fall as non-malignant claims were cleaned out of companies' backlogs and new filings shifted toward malignancies. But how much further the dismissal rates drop will depend on other factors in the litigation, such as the quality of future claims (will they provide product identification, which may be harder to obtain with time?) and settlement strategy by defendants (will they insist on such identification before settling?).
Average Dollars Paid per Resolved Claim Increased in 2010
- Historically, average dollars paid per resolved claim (including both settled and dismissed claims) have exhibited a saw tooth pattern, with annual changes either up or down of more than 35%.
- Over the past two years, average values per resolved claim have increased, with 2010 reaching a new high of over 1.6 times 2001 levels.
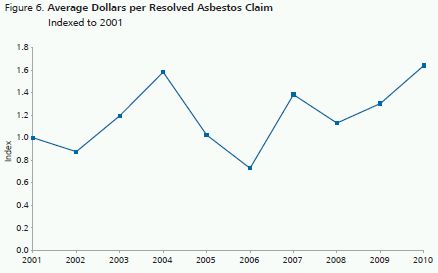
- The higher values per resolved claim may represent a shift in the mix of claims resolved, with more cancers and fewer non-malignants, rather than an increase in the settlements for each disease. For example, Honeywell provided data on costs to resolve all claims along with average settlement values for malignant and non-malignant claims. For this defendant, although average values per resolved claim peaked this year, average settlement values for both cancers and non-malignant diseases were below 2008 levels.
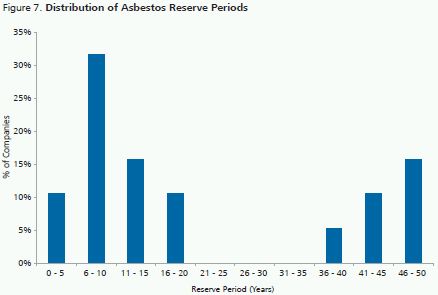
Reserve Periods Continue to Vary Widely Among Companies Reporting Asbestos Reserves
- In their 10-K filings, companies reported reserves to cover future asbestos liabilities over periods as short as five years or as long as 50 years, with some companies reporting liability through a fixed date and others reporting liabilities over a rolling period.
- The average number of years reported in 2010 filings was 23 years; the median was 15 years.
- The distribution is bi-modal, with some companies reserving for a long horizon, while the majority are clustered with reserves of five to 20 years.
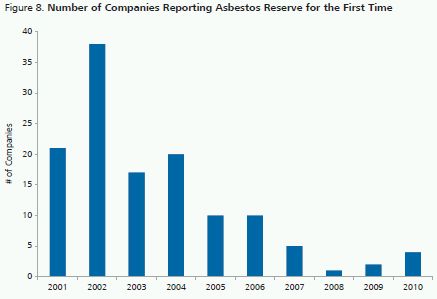
Fewer Companies Are Reporting a Reserve for the First Time
- The start of the decade saw the number of companies reporting asbestos reserves for the first time increase. In 2001, over 20 companies first recorded an asbestos-related reserve. The following year, the number almost doubled.
- Although each year new firms continue to be added to the list of companies taking a reserve, the number of companies being added has dropped. In 2009 and 2010, fewer than five companies reported taking a reserve for the first time, each year.
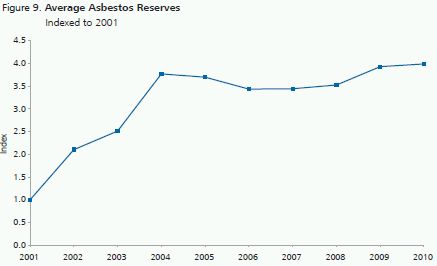
Reserve Levels have Plateaued after Large Increases at the Start of the Decade
- By 2004, asbestos reserves were on average almost 4 times as high as in 2001, but have remained fairly stable since then, at 3.5 to 4 times 2001 levels.3
- The early increase both in companies reporting reserves and in the amount of reserve recorded mirrored the worsening filing and payment trends discussed above—as claims and costs mounted, companies took a reserve or increased their reserves.
- The recent stability or current increase in reserves means that, on average, companies have been raising their estimates of future liabilities (during their respective reserve periods) by amounts equal to or more than the reduction realized by paying current claims.
- The recent decline in filings and pull-back in total indemnity payments could reverse this trend, halting increases in future liability estimates or even lowering forecasts depending on the extent to which companies have already factored these recent favorable trends in their estimate of future liabilities.
Summary of Trends Through 2010: Aggregate Results Continue to be Generally Favorable to Defendants
- As the decade ends, filings are down; total indemnity payments have stabilized well below the 2004 highs; and pending claims continue to fall—all favorable trends for defendants.
- At the same time, dismissal rates have continued to drop and average dollars per resolved claim have increased. While these trends may appear to lead to higher costs, these changes are consistent with the mix of claims shifting toward more malignancies (as non-malignant filings drop).
- Moreover, while the decade began with rapid growth of filings, total indemnity payments, pending claims, and reserves, the current environment is notable for the stability in filings, total indemnity payments, and reserve levels.
- Going forward, we will see how some of the factors which may affect future filings and payments will play out, including whether the pace of the litigation will change as non-malignant claims no longer clog up certain jurisdictions, and what effect, if any, the new asbestos trusts will have on filings and settlements for still-solvent defendants.
Footnotes
* The authors would like to thank David McKnight for his contributions to the reserves analysis and Paul Hinton for his comments and suggestions.
1. As we have discussed in prior updates, these reforms include, for example, the creation of a deferred docket through a case management order for unimpaired claims filed in New York (2002), the creation of inactive dockets in Texas, Louisiana, and Georgia through legislation (2005), a decision in the Silica MDL challenging the medical findings of certain historically high volume doctors who supplied supporting evidence in both silica and asbestos-related cases (2005), and the subsequent banning of documentation from these same doctors by many of the bankruptcy trusts.
2. Data from the most recent Form 10-K were used whenever available. We included only data reported at the individual claim level and for companies reported at least two consecutive years in the period. The indexes reported below are an average of trends observed at the company level, and each chart may contain different companies, depending on which company reported each statistic.
Data for prior years were updated if companies changed previously reported information. As a result, the graphs in the current update may differ from those in the previous update over the earlier period.
3. The index includes companies reporting at least two years of reserve data, so the initial increase when a company first started reporting a reserve is excluded.
The content of this article is intended to provide a general guide to the subject matter. Specialist advice should be sought about your specific circumstances.