

- within Finance and Banking, Intellectual Property, Media, Telecoms, IT and Entertainment topic(s)
- with readers working within the Accounting & Consultancy, Technology and Securities & Investment industries
Article by Stephanie Plancich, PhD and Svetlana Starykh1
December 2009
INTRODUCTION
Over the past three years, federal securities class action filings have surged, driven by the credit crisis. Cases went from a low of only 130 in 2006 up to a peak of 253 in 2008, when approximately 40% of all cases filed had some credit crisis-related allegation. In total, over the period from January 2007–November 2009, there have been 206 credit crisis cases filed.
While the credit crisis continued to drive filings activity in 2009, with over 60 credit crisis cases filed through November 30, the pace of these cases has gradually declined throughout the year. Credit crisis case filings in the first half of the year outnumbered second-half filings by approximately two to one.
Despite this decline in credit crisis filings in recent months, however, total securities class action filings have not dropped off sharply, as other types of cases replaced credit crisis filings. Instead, filings are on pace to reach approximately 120 cases in the second half of 2009, for a total of approximately 235 cases for the year.
A number of securities class action cases have also resolved in 2009. In particular, a settlement in the IPO securities laddering cases was finalized this year, resolving 309 cases for a total of $568 million in one fell swoop. If these settlements are included in the average, then the 2009 average settlement is well below prior years, because, on average per case, each IPO laddering settlement was relatively small. If these cases are removed from the data, on the other hand, the median settlement value in 2009 is $9 million, similar to the 2007 and 2008 medians. Thus, after accounting for the IPO laddering settlement, there is no discernable downward or upward trend in settlement values this year.
Investor losses, a crude proxy for plaintiff damages developed by NERA that can be calculated using public data, have historically been the primary determinant of settlement size. In recent years, median investor losses for settled cases have been well over $300 million. For cases filed in 2008 and 2009, though, median investor losses have been almost 40% higher, over $500 million. This may be an indication that, although there has not been an upward trend in recent settlements, future settlements may be larger once these recently filed cases begin to settle in more substantial numbers.
FILINGS
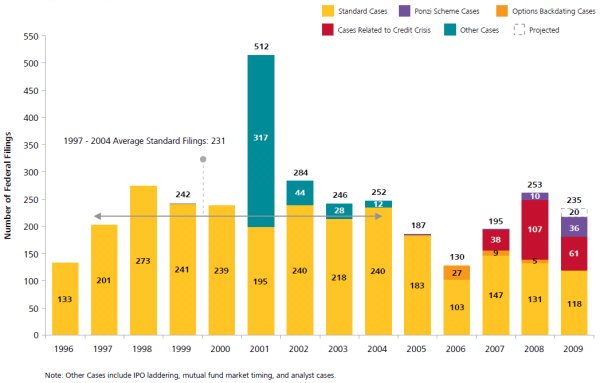
Through November 30, 2009, 215 federal securities class actions were filed. If filings continue at this pace through the end of December, we project approximately 235 filings for the year. This total is down from the 2008 count, but is still well above the levels of filings in 2005 and 2006, before the start of the credit crisis.2 See Figure 1.
Cases related to the credit crisis have made up a large fraction of filings over the past three years. In 2008, over 40% of cases filed were credit crisis cases. In 2009, however, this proportion has decreased to around 30%. A number of filings related to Ponzi scheme allegations were also brought in 2009, a surge that started with the Bernard L. Madoff scandal at the end of 2008.
Figure 1. Federal Filings
January 1, 1996 – November 30, 2009
The growth and recent decline of credit crisis cases over time can be seen in Figure 2. The earliest credit crisis cases were filed at the beginning of 2007 and made up a substantial fraction of filings throughout 2008. This pattern continued into 2009, but then, by the second half of the year, credit crisis filings began to slow down.
Figure 2. Federal Filings: One-Month Intervals
January 1, 2007 – November 30, 2009
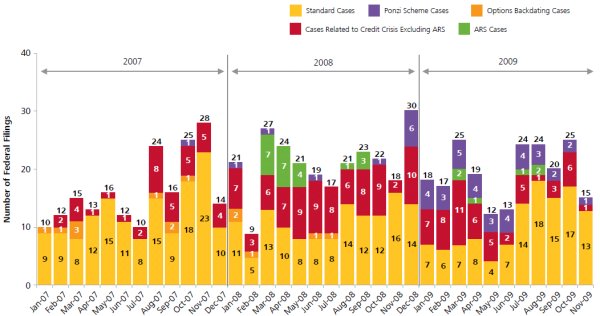
Auction-rate securities (ARS) cases, a type of credit crisis case, also spiked in 2008.3 While these cases have not disappeared in 2009, neither have they made up a substantial portion of recent filings.
Although the news of the Madoff and R. Allen Stanford Ponzi scheme allegations broke at the end of 2008 and early part of 2009, there has been a number of Ponzi scheme cases brought throughout the year. Through November, there has been at least one Ponzi-related filing each month.
Finally, although credit crisis filings have not been as frequent in the second half of 2009 as in prior months, total levels of monthly filings have remained relatively high. Standard cases appear to have made up much of the decrease in filings related to a slowdown in credit crisis litigation this year.
One source of the increase in these standard filings in the second half of the year is the wave of filings on behalf of investors in various exchange-traded funds (ETFs), a new litigation phenomenon.4 In these cases, investors typically allege that the defendants failed to disclose risks and the probability of potential losses associated with the investments. There were 13 ETF-related cases filed between August and November 2009, which are included as standard filings in Figures 1 and 2.
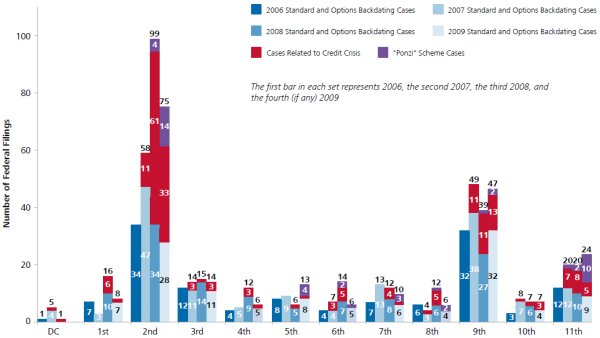
Historically, securities class action filings have been concentrated in the Second and Ninth Circuits, and 2009 is no exception. The Second Circuit, which includes New York, has been dominant in terms of credit crisis filings in both 2008 and 2009, but year-to-date in 2009, there have been more standard cases filed in the Ninth Circuit than in the Second.
Figure 3. Federal Filings By Circuit, Year, And Type Of
Case
January 1, 2006 – November 30, 2009
Since the beginning of the credit crisis in 2007, filings have been increasingly concentrated against primary defendants in the financial sector. This trend continued in 2009, with 53% of all filings naming a finance sector defendant. In 2009, a number of these financial defendants included mutual funds and issuers of other investment products. See Figure 4.
Figure 4. Percentage Of Filings By Sector And Year
January 1, 2005 – November 30, 2009
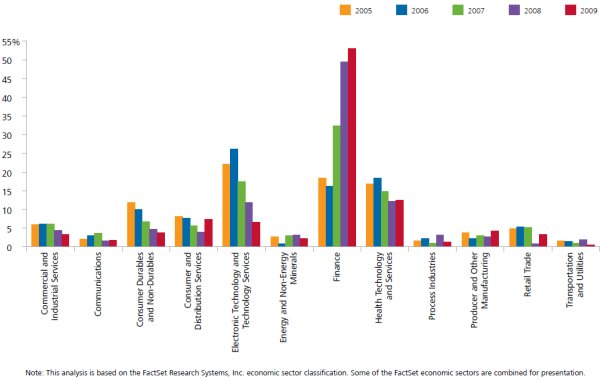
While cases have been clustered in the finance sector, other sectors have also continued to see substantial filing activity. The health technology and services sector remains a prime target for litigation. Continuing a trend observed over the past few years, companies in electronic technology and services sector have been targeted relatively less frequently this year, with only 7% of filings in 2009 naming defendants in this sector, as compared to 12% in 2008 or 26% in 2006.
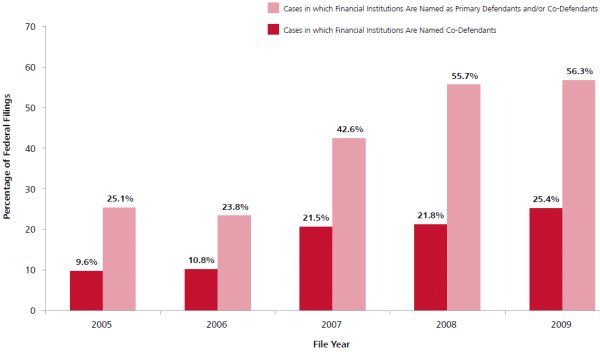
Not only have finance firms been named as the primary defendant in a large percentage of filings over the past few years, but many cases—particularly credit crisis-related cases involving the issuance or sale of securities—also name finance firms as co-defendants, including underwriters, asset management firms, rating agencies, fund managers, and broker-dealers.5 Figure 5 shows that in both 2008 and 2009, over 55% of cases name a finance firm as a co-defendant and/or primary defendant. This is approximately double the percentage observed in 2005–2006, before the credit crisis. See Figure 5.
Figure 5. Cases In Which Financial Institutions Are
Named Defendants As Percentage Of All Federal Filings
January 1, 2005 – November 30, 2009
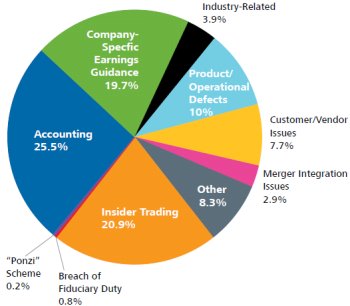
Prior to the credit crisis, during 2005–2006, the most common types of allegations listed in securities class action complaints related to accounting, company-specific earnings guidance, and insider trading.6 See Figure 6.
Figure 6. Allegations In Federal Filings
January 1, 2005 – December 31, 2006
Since the dawn of the credit crisis, the relative mix of allegations has shifted. Twenty-five percent of allegations relate to product and operational defects, frequently related to financial products that are alleged to have failed to perform as indicated by the defendant. Breach of fiduciary duty claims have also increased since the time of the credit crisis, as have Ponzi scheme claims. See Figure 7.
Figure 7. Allegations In Federal Filings
January 1, 2007 – November 30, 2009
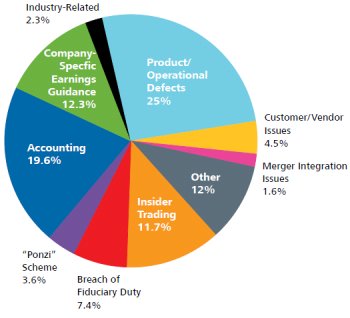
And while accounting and earnings-guidance allegations remain common, there has been a decline in the relative fraction of allegations related to insider trading. In fact, looking at 2009 alone, only 5% of the allegations relate to insider trading, down from over 20% pre-credit crisis.
The majority of complaints in securities class action litigation cases are filed within the three-month period after the end of the alleged class period—in 2007–2009, 28% of complaints were filed within two weeks of the end of the alleged class period, and 84% of all complaints were filed within one year from the end of the class period. See Figure 8.
Figure 8. Time To Filing Of First Complaint
January 1, 2007 – November 30, 2009
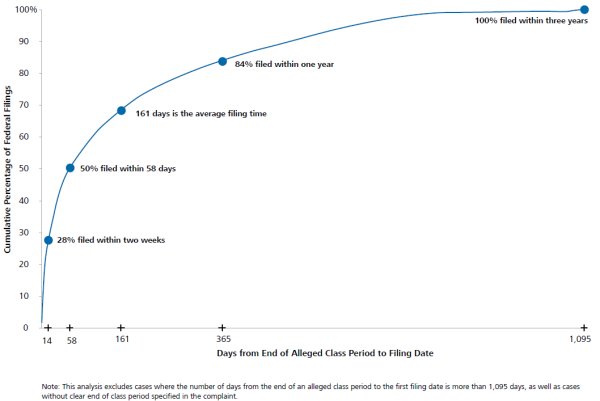
On average, the time from end of class period to first filing has been 161 days for cases filed over the past three years. In the last half of 2009, however, there has been a shift in this pattern, with the average time to filing increasing to 279 days and with only 69% of cases filed within one year from the end of the alleged class period. It is too soon to tell if this extension of the time to filing is a new trend. In fact, it may be a temporary phenomenon related to the drop-off in credit crisis cases: one hypothesis for this shift is that plaintiff firms, focused on the large credit crisis litigation over the past two years, are only now able to focus on bringing other, non-credit-crisis cases with older class periods.
RESOLUTIONS
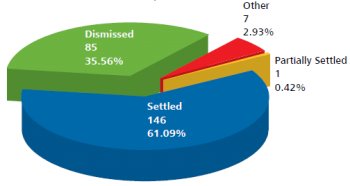
Historically, while some cases resolve within a year or two of filing, others may take a number of years to resolve. Thus, only by looking at a cohort of cases filed some time ago can the ultimate mix of settlements and dismissals be determined.7 As an example, Figure 9 shows the status of cases filed in 2000: of these, 36% have been dismissed and 61% have settled. Even almost a decade after filing, there are still approximately 3% of cases that have yet to reach a final resolution. These cases may be still pending in the courts, or may have been abandoned by plaintiffs.
Figure 9. Status Of 239 Federal Securities Class Actions
Filed In 2000
As of November 30, 2009
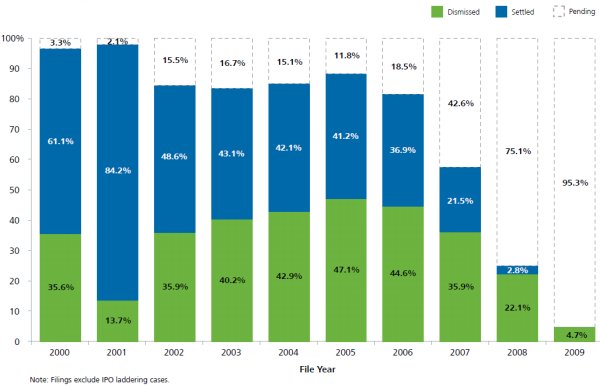
For more recent filings, the majority of cases remain pending—over 75% of the 2008 filings are still unresolved, and over 95% of the 2009 filings are still pending. See Figure 10. For the cases filed over the past few years, a higher proportion of the resolutions have been dismissals instead of settlements: this is unsurprising, as motions to dismiss are usually filed relatively early in the litigation process, often before settlement discussions commence. Ultimately, based on historical experience, we expect that a higher proportion of these recent filings will result in settlement.
Figure 10. Status Of Cases As Percentage Of Federal
Filings By File Year
January 1, 2000 – November 30, 2009
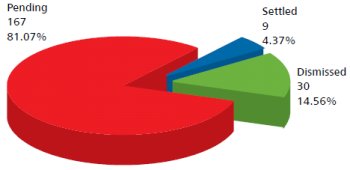
Because cases related to the credit crisis were filed recently, only a small fraction of these cases—like other recent filings—have resolved. As of November 30, 2009, over 80% of the credit crisis cases remained pending. A higher fraction, 15% of cases, has been dismissed compared to only 4% (nine cases) that have settled. See Figure 11. Again, this pattern is consistent with what we observe more generally in the data, where cases are more likely to dismiss than settle within the first few years from filing.
Figure 11. Status Of 206 Credit Crisis-Related Federal
Securities Class Actions
January 1, 2007 – November 30, 2009
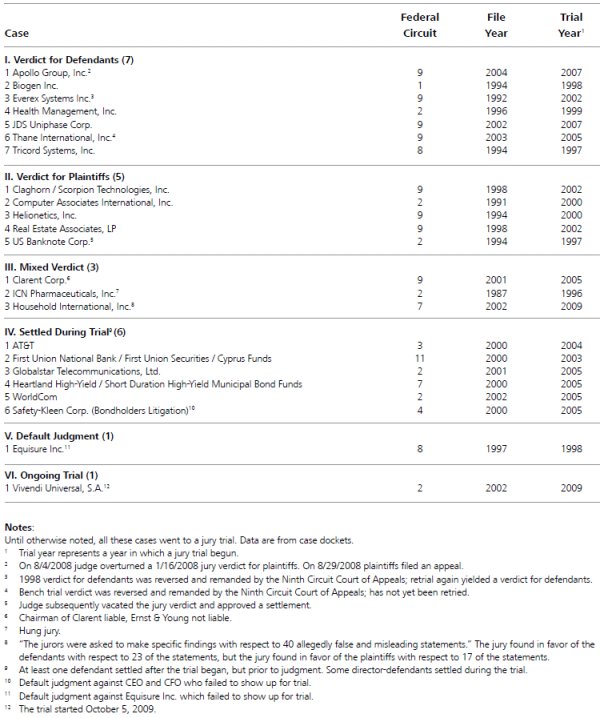
While the vast majority of securities class action cases result in dismissal or settlement, a tiny fraction of cases ultimately go to trial. For example, only four of the cases filed in 2000 have gone to trial, and all settled with at least one defendant during the trial. A full list of securities class actions that went to trial following the Private Securities Litigation Reform Act (PSLRA) is included in Table 1.
Once cases go to trial, they do not always reach an unambiguous plaintiff or defense verdict. Instead, one or more of the defendants might settle during the trial, or a verdict may be reached for one party but later overturned.
Because it is unusual for securities class action cases to go to trial, 2009 stands out as an exceptional year, with two cases taken to trial. The first case, against defendant Household International, Inc., resulted in a mixed verdict in the liability phase of the case in May. The second case, brought against Vivendi, started October 5 and is still ongoing at the time of this publication.8
Table 1. Twenty-Two Securities Class Actions That Went To Trial After PSLRA
As mentioned above, historically more securities class action cases resolve in settlement than in dismissal or verdict. There has been a large variation in the amounts of these historical settlements, both across cases and over time.9
Figure 12 shows the pattern of average settlement values, by year, since 1996—these range from a low of only $8 million in 1996 up to a high of $80 million in 2006. But these averages are strongly influenced by large "outlier" settlements. For example, four settlements over $1 billion each in 2006 drive the $80 million average.
Figure 12. Average Settlement Value ($MM), All
Cases
January 1, 1996 – December 31, 2009
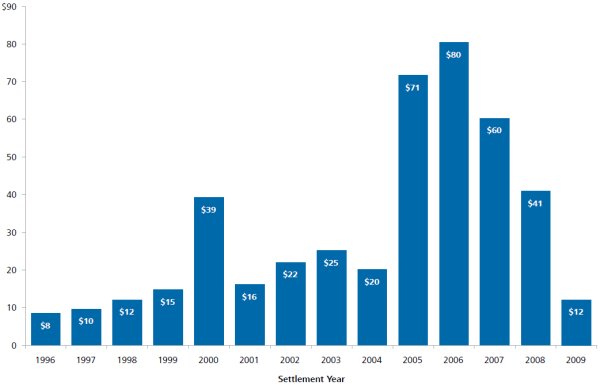
The average settlement in 2009 is $12 million, the lowest value in this decade. This low average is also driven by an unusual "outlier" settlement, although on the low rather than the high end. More specifically, in 2001 and 2002, over 300 securities class action cases were filed related to allegations of laddering following IPOs (see Figure 1). In 2009, all of these cases finally reached a settlement. While the total amount to settle these cases was large—$568 million for 309 cases—on average, this is less than $2 million per case. And, because so many of these small-value cases resolved all at once this year, the average settlement amount in 2009 is quite low.
If the outlier settlements are removed from the averages—both dropping all cases where the settlement was over $1 billion as well as the 309 IPO laddering cases—then the pattern of average settlements exhibits much less variability over time. In 2009, after removing the IPO cases, the average settlement value is $42 million. See Figure 13.
Figure 13. Average Settlement Value ($MM), Excluding
Settlements Over $1 Billion And 309 Settlements In IPO Securities
Litigation
January 1, 1996 – December 31, 2009
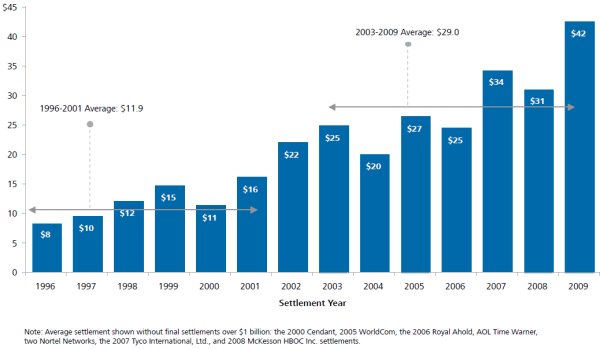
There has been a general increase in average settlement values since 1996. In particular, the average prior to the passage of the Sarbanes Oxley Act ("SOX") in 2002 is $11.9 million, well below the post-SOX average settlement of $29 million.
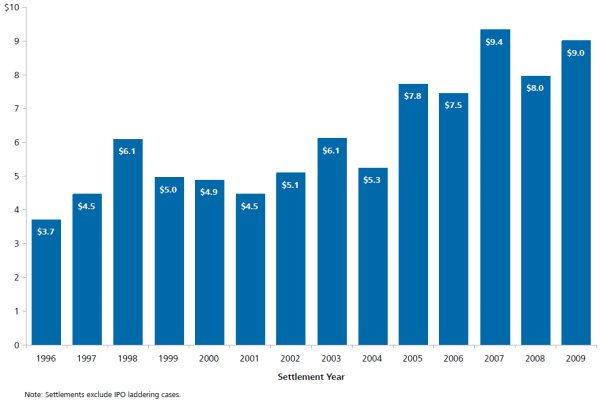
One way to observe the trends in settlement values over time without the influence of outlier settlements is to focus on median settlements rather than averages.10 In 2009, the median settlement was $9 million, similar to the medians observed in 2007 and 2008. Thus, while over the 14-year period shown in Figure 14 there has been a gradual increase in median settlement amounts, no recent trend in median settlements is evident in the past few years.
Figure 14. Median Settlement Value ($MM)
January 1, 1996 – December 31, 2009
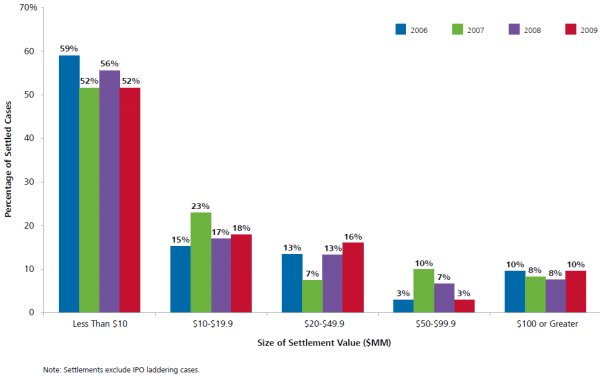
Similarly, the distribution of settlement values has been relatively steady over the past few years. Since 2006, between 50% and 60% of settlements each year have been less than $10 million, and between 8%–10% of settlements have been $100 million or greater. See Figure 15.
Figure 15. Distribution Of Settlement Values ($MM)
January 1, 2006 – December 31, 2009
As mentioned above, at the very top end of the settlement distribution there are a small number of "mega-settlements," many of which have resolved for over $1 billion. The top 10 of these huge securities class action settlements are listed in Table 2.
Table 2. Top 10 Securities Class Action Settlements
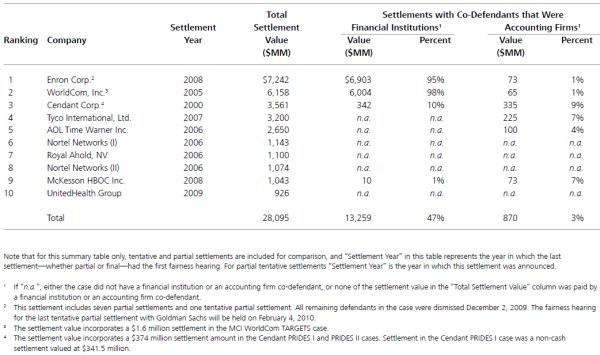
Only one of these top settlements had a final resolution in 2009: United Health Group, for $926 million. It also seems likely that the Enron settlement, which is still partial and tentative, will finalize within the next few months, since all remaining non-settled defendants have been dismissed and a settlement approval hearing for the final outstanding partial settlement is scheduled for February 2010.11
In total, these top 10 settlements sum to more than $28 billion, of which over $13 billion, or 47%, of this aggregate settlement amount was paid by the "deep pockets" of financial institution co-defendants. Another 3% of the total was paid by accounting firm co-defendants.
INVESTOR LOSSES AND SETTLEMENTS
NERA has examined the relationship between settlement size and various case attributes for cases filed since the passage of the PSLRA. We find that investor losses, which can be calculated using publicly available data, historically have been the single most powerful determinant of settlements, explaining approximately 50% of their variation, controlling for other characteristics of the case.12
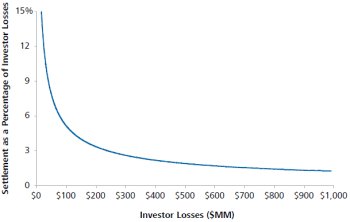
While investor losses are strongly correlated with settlement amounts, the two do not move together at a one-to-one ratio. Instead, as investor losses increase, settlements increase at a much lower rate: a 1.0% increase in investor losses results in an approximately 0.4% increase in the size of the expected settlement, other factors being held constant.13 See Figure 16.
Figure 16. As Investor Losses Rise, Expected Settlements As A Percentage Of Those Losses Decline
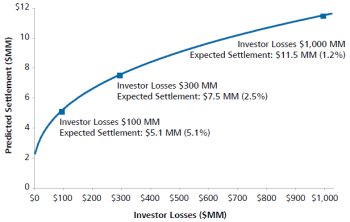
Another way to look at the relationship between investor losses and settlement values is to compare the ratio of these two numbers for cases with losses of different amounts. Holding all other case characteristics constant, at their respective means, a case with investor losses of $100 million is expected to have a settlement that is around $5.1 million or 5.1% of investor losses. A case with $1 billion in investor losses is expected to settle for $11.5 million, only 1.2% of losses. See Figure 17.
Figure 17. Expected Settlement Rises More Slowly Than Investor Losses
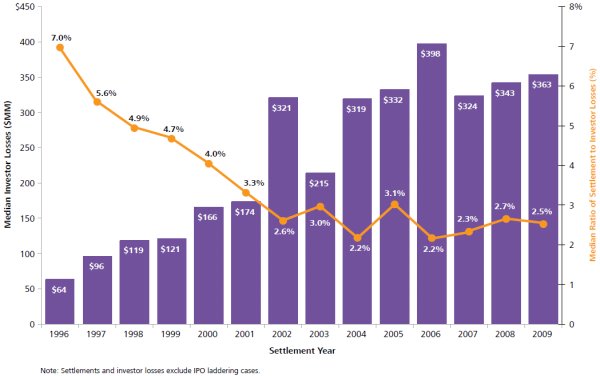
Median investor losses for settled cases have ranged between $320 million and $400 million over the last six years, and have remained in a tighter range, between $324 million and $363 million, from 2007 to 2009. Like median settlements, there has been no recent spike in median losses; because investor losses are so strongly correlated with settlement size, this pattern is not unexpected. See Figure 18.
Figure 18. Median Investor Losses ($MM) By Settlement
Year
January 1, 1996 – June 30, 2009
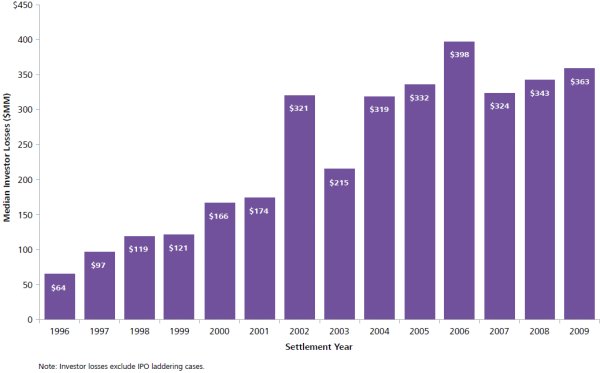
Similarly, just as median settlement values have generally increased since 1996, median investor losses have also gradually increased over this 14-year horizon, up from less than $100 million in 1996 and 1997 to over $300 million since 2004.
The ratio of settlements to investor losses has gradually changed over time. In 1996 and 1997, this ratio was over 5%, i.e., at the median, a settlement was 5% to 7% of the investor loss amount. See Figure 19. By the end of the 1990s, however, this ratio had declined substantially, so that the median settlement was between 2% and 3% of investor losses from 2002 onward. Over the past few years, this ratio has stayed at approximately 2.5%. Thus, although settlements remain strongly correlated with investor losses, at the median settlement values have not increased as rapidly as investor losses over the past decade.
Figure 19. Median Investor Losses And Median Ratio Of
Settlement To Investor Losses By Settlement Year
January 1, 1996 – December 31, 2009
Because investor losses have historically been strongly correlated with settlement values, a natural question is what the investor losses of recently filed cases are: the size of the losses for these recent filings might give at least a preliminary indication about the amount for which the cases might ultimately settle.
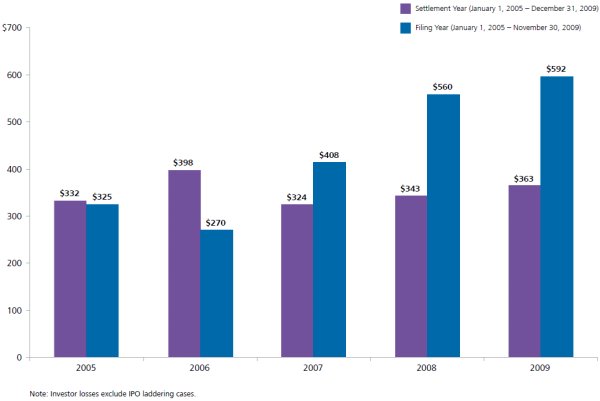
One comparison, shown in Figure 20, is to look at the median investor losses of cases filed in recent years relative to the losses for cases settled in those same years. In 2008 and 2009, the median losses for filed cases have been well over $550 million, about 40% higher than the median losses for cases settled in the same years. Some of these recently filed cases ultimately will be dismissed, and recent filings are likely to differ from settled cases in many other dimensions as well. Abstracting from those differences, however, the recent higher investor losses are a signal of potentially higher settlements in the future.
Figure 20. Federal Filings Median Investor Losses ($MM) By Settlement And Filing Year
In 2007 and 2008, median investor losses for credit crisis cases differed substantially from the median losses for other filings. See Figure 21. In 2007, the median credit crisis case had losses more than three times as large as a non-credit-crisis case, and in 2008 median credit crisis losses were more than eight times as large as those of other cases. Based on the relationship between investor losses and settlements, these large losses are a preliminary indication that credit crisis cases may result in large settlements— although the fact that several of the credit crisis defendants filed for bankruptcy is a potential mitigating factor, since bankrupt defendants tend to have lower settlement values, holding all else equal.
Figure 21. Median Investor Losses ($MM) For Cases
Related To Credit Crisis And Other Cases By Filing Year
January 1, 2007 – November 30, 2009
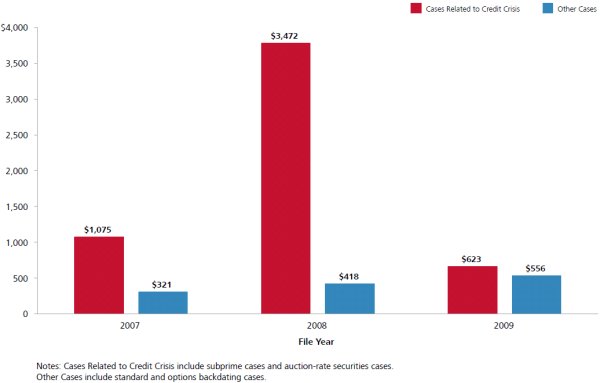
In 2009, however, this pattern has vanished: the median investor losses for credit crisis cases are similar to the median for other cases. This may be correlated with the fact that the "second wave" of credit crisis filings looked different from the first wave. While the initial credit crisis cases were filed against mortgage lenders and other major financial institutions that had massive losses—many went bankrupt—later credit crisis cases were, for example, more likely to be brought against defendants outside of the financial sector. Some of these companies held securities affected by the crisis in their portfolios or experienced problems with commercial mortgage obligations, but did not have their primary business in the troubled financial sector. Thus, they had relatively lower amounts of investor losses. In addition, the more recent cases were also more likely to be brought against smaller financial institutions, with smaller potential investor losses than the first-wave defendants.
CONCLUSION
Over the past three years, the turmoil in the financial markets associated with the credit crisis has led to an increase in securities class action filings—from 2007 through November 2009, there have been 206 credit crisis cases. But by the second half of this year, the pace of credit crisis filings had begun to slow—there were 42 credit crisis cases in the first six months of 2009, more than twice as many as filed from July through November. Despite this slowdown, however, total securities class action filings have not substantially declined. Instead, other types of filings have replaced the credit crisis cases in the second half of the year, and, if filings continue at this pace through December, will result in a total of 235 filings for the year.
Although only a small fraction of the credit crisis cases have resolved so far, there has been a substantial amount of settlement activity in 2009. This activity was dominated by the settlement of the 309 IPO laddering cases filed in 2001 and 2002: although the total settlement for these cases, $568 million, would be large enough to break the list of top 20 settlements of all time, on a per-case basis the average settlement for each case is quite small. Including these cases in the average settlement amount, then, leads to a low average for 2009. If the IPO laddering cases are excluded from the data, then the 2009 median settlement is quite similar to the values from the past two years.
Will median settlements continue to remain stable in future years? The median investor losses for recent filings in 2008 and 2009 are much higher than the losses of recently settled cases, which is one preliminary indication that future settlements may rise. Investor losses of the credit crisis cases filed in 2007 and 2008 were also substantially larger than other cases, signaling potentially large settlements for this group of cases, although this divergence has evaporated in 2009.
Footnotes
The opinions expressed herein do not necessarily represent the views of NERA Economic Consulting or any other NERA consultant. Please do not cite without explicit permission from the authors.
1. This edition of NERA's research on recent trends in shareholder class action litigation expands on previous work by our colleagues Lucy Allen, Elaine Buckberg, Frederick C. Dunbar, Todd Foster, Vinita M. Juneja, Denise Neumann Martin, Ronald I. Miller, and David I. Tabak. We gratefully acknowledge their contribution to previous editions as well as this current version. The authors also thank Jake George and David Tabak for helpful comments on earlier drafts of the paper. In addition, we thank Nicole Roman, Carlos Soto, and many NERA Securities Practice researchers for their valuable assistance with this paper. These individuals receive credit only for improving this paper; all errors and omissions are ours.
2. Data on filings come from multiple sources, including RiskMetrics Group/Securities Class Action Services (SCAS), Factiva, Bloomberg, FactSet, SEC filings, and the public press. In compiling our data, we seek information on all unique class actions alleging damages with regard to the purchase, ownership, or sale of securities. Most of our summary statistics below are based on data for cases filed in US federal courts. Until cases are consolidated, we report multiple filings that potentially are related to the same alleged fraud if complaints are filed in different Circuits. Similarly, until cases are consolidated, we report multiple filings if different cases are filed on behalf of investors in common stock and other securities. If cases are ultimately consolidated, the data are adjusted.
3. See NERA working paper, "Auction-Rate Securities: Bidder's Remorse?" by Stephanie Lee. This NERA study can be found at: http://www.nera.com/image/PUB_Auction_Rate_Securities_0708.pdf.
4. See NERA Working Paper "Rebalancing Act: A Primer on Leveraged and Inverse ETFs," by Raymond Wong and Kara Hargadon, at: http://www.nera.com/image/PUB_ETF_Leveraged_1009_web.pdf.
5. For this analysis, audit firms are not included as financial sector co-defendants. In a separate analysis, we find that 9.9% of cases filed in 2009 name an accounting firm as a co-defendant.
6. Most securities class action complaints have multiple allegations. All allegations are included in this analysis, such that the total number of allegations exceeds the total number of filings.
7. Our dismissal statistics include summary judgments and verdicts for defendants, but exclude partial dismissals. Due to the nature of dismissal data, on one hand, our dismissal counts in this section may be slightly overstated because they may include some dismissals without prejudice that will be reversed by amended and better-pled complaints, dismissals with prejudice that will be successfully appealed, or cases that will settle after a dismissal without prejudice and before the expiration date for plaintiffs to re-file an amended complaint. On the other hand, dismissal counts may be slightly understated because we currently do not track dismissals with prejudice that subsequently settled or reverted to pending status. These two effects tend to offset one another.
8. The Vivendi case involves claims by "F-cubed" investors, i.e., claims by foreign shareholders of a foreign-domiciled company who bought their shares on foreign exchanges. Thus, the outcome of this trial may have a significant impact on cases against foreign companies involving foreign shareholders. See, for example, "Shareholder Suit Against Vivendi Starts," by Matthew Saltmarsh, The New York Times, October 5, 2009 for more detail about the case.
9. Unless otherwise noted, tentative settlements and cases in which not all non-dismissed defendants have settled are not included in our settlement statistics. We define "Settlement Year" as the year in which the first court hearing related to the fairness of the settlement occurred. For cases with multiple partial settlements, a settlement year is determined by a court fairness hearing date of the last partial settlement that concludes the case.
10. The 2009 median settlement does not include the 309 IPO laddering cases. If those were included in the calculation, the 2009 median settlement would be $1.5 million.
11. See "Enron Shareholders Drop Suit Against Banks" by Elaine Meyer, Securities Law 360, dated December 3, 2009, at: http://securities.law360.com/articles/137320, and In re Enron Securities Litigation, Notice of Pendency and Partial Settlement of Class Action, dated October 29, 2009.
12. Investor losses are measured by comparing a company's return to the return on the S&P 500 over the class period, and by using the proportional decay trading model to estimate the number of affected shares of common stock. We use investor losses as a crude proxy for plaintiff-style damages. The relationship between settlement values and investor losses is estimated in logs.
13. This relationship between investor losses and settlements is based on NERA's settlement prediction model, controlling for other case characteristics and overall price inflation. This model explains over 60% of the variation in settlements, across more than 900 cases filed after January 1, 1996 and settled through December 31, 2009.
The content of this article is intended to provide a general guide to the subject matter. Specialist advice should be sought about your specific circumstances.