

- within Government, Public Sector and Intellectual Property topic(s)
- with readers working within the Banking & Credit, Technology and Utilities industries
Article by Stephanie Plancich, PhD and Svetlana Starykh1
Please click here to read the article and its footnotes in full
Filings Remain High, Fueled By Credit Crisis And Ponzi Scheme Claims; Median Settlements Remain Under $10 Million
INTRODUCTION
Federal class action securities filings began to surge in 2007 with the subprime lending collapse. As the subprime lending meltdown grew into a full-blown credit crisis, the number of filings related to the credit crisis also grew, both in absolute number and as a fraction of all filings. In 2008, driven by this crisis, filings reached a peak of 259 cases, the highest level since 2002. In the first half of 2009, filings have come in at a similar rate, with 127 filed by June 30, on pace for over 250 for the full year.
In addition to the increase in credit crisis cases, there has also been a surge in cases related to Ponzi schemes. With the discovery of the Ponzi scheme by Bernard Madoff, filings in December 2008 spiked. Cases related to Madoff's investment firm, as well as a number of other Ponzi scheme-related filings, continued into 2009, with over 20% of the year-to-date filings containing Ponzi scheme allegations. In 2009, filings hit their highest level in March, and monthly filings have gradually declined each month in the second quarter.
Because litigation has been centered on credit crisis cases, it has been concentrated against defendants in the finance sector. Not only have well over half of the cases filed named a financial sector company as the primary defendant in 2008 and 2009, but approximately 30% of filings over this same time period also named a financial sector co-defendant. In total, approximately 67% of the cases filed in 2009 named at least one financial company as a primary or co-defendant.
While a large amount of the recent litigation activity is related to the credit crisis, most credit crisis cases remain pending; only a small fraction have been dismissed, and just three credit crisis cases have settled. Given this pattern, it is too early to say for sure how these cases may ultimately resolve.
We do find that of cases resolved after the Supreme Court's decision in Dura in April 2005, which required that plaintiffs' show loss causation related to a corrective disclosure of an alleged misstatement, a higher fraction have been dismissed. The pending credit crisis cases will resolve in this post-Dura era, perhaps increasing the likelihood that the cases will be dismissed. In particular, credit crisis plaintiffs may face challenges demonstrating loss causation related to specific corrective disclosures, given the extreme volatility and large price declines in the markets generally and the major negative finance industry shocks.
For the cases that have settled in recent years, we find that median values have remained steady, staying below $10 million per settlement. As in the past, we find that settlements are strongly correlated with measures of investor losses, a market-adjusted measure of losses during the class period that is correlated with plaintiff damages estimates. In 2009, median investor losses for a settling case were $289 million, slightly below the median losses in recent years.
While there has not been any major spike in the median investor losses or settlement values for cases resolved in 2008 or 2009, there has been an increase in the median investor losses of cases filed during this time period. Median losses for cases filed in this time period are over $600 million, much higher than the median losses for recently settled cases. In particular, credit crisis cases have very high median losses. Also, because the number of cases filed has been increasing over the past two years at the same time that investor losses have been increasing, we find that total investor losses associated with recent filings have grown substantially: in 2008, total investor losses for filed cases were over $450 billion, and in 2009, total investor losses are on pace to exceed $300 billion.
As the credit crisis cases begin to settle, the large investor losses associated with these cases lead us to expect that the future settlement values may be larger than recent settlements. On the other hand, historically companies with substantial resources—higher market capitalization and other measures of solvency—pay larger settlements, and companies affected by the credit crisis may no longer have such substantial resources to make such large settlement payouts. Only once more of the outstanding credit cases begin to settle will we be able to tell which of these two effects will dominate the future trend in settlement values.
FILINGS
Trends In Filings
In 2008, filings hit a five-year high, driven up by the surge in litigation related to the credit crisis.2 This trend started with the subprime lending meltdown in 2007 and has continued into the first half of 2009. Through June 30, 2009, there were 127 federal securities class action filings. If filings continue at this pace in the second half of the year, 2009 will receive approximately the same number of filings as 2008, or more than 250. See Figure 1.
Figure 1. Federal Filings January 1, 1996 – June 30, 2009
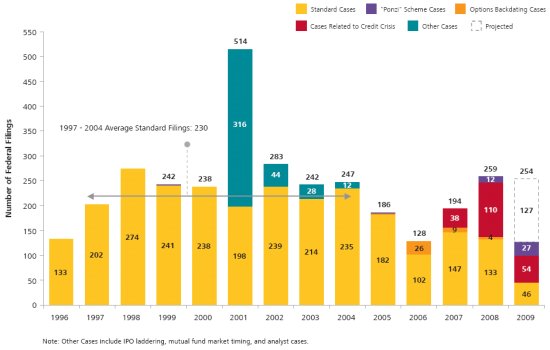
Annual filings on average over 2008 and 2009 are on pace to come in above the average level of 230 standard filings over the 1997-2004 period. While in 2001 and 2002 total filings exceeded this average level, this was driven by the large number of one-time cases related to the IPO laddering filed during those years, and those IPO laddering allegations have not been repeated in subsequent years.
In 2009, cases related to the credit crisis continue to drive filings: 54 of the 127 filings this year, or over 40% of filings, had allegations related to the credit crisis. In addition, cases related to Ponzi schemes have made up a substantial fraction of the cases in 2008 and 2009, as the revelations of alleged schemes perpetrated by Bernard Madoff, R. Allen Stanford, Howard K. Waxenberg, Thomas Petters, and others led to many filings starting in December 2008.
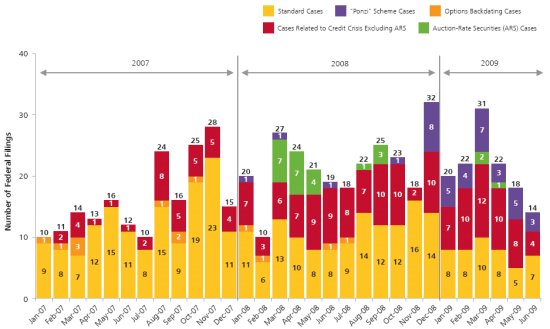
Looking at monthly patterns of filings in Figure 2, the growing importance of credit crisis filings over the last 30 months is evident: credit crisis cases are a small fraction of cases starting in early 2007 and become a larger fraction of filings over time.
Cases related to auction-rate securities (ARS)—another type of credit crisis case—first appeared in 2008, starting in the spring immediately following the failures in the markets for these securities. These initial cases were brought against the banks and broker-dealers who made markets in auction-rate securities. In addition to these initial filings, more cases related to auction-rate securities have been filed in 2009. These more recent cases have been typically brought against companies or mutual funds which held ARS in their portfolios, as opposed to the brokers selling the securities directly.3
Options backdating cases made up almost 20% of all filings in 2006, and these cases persisted into 2007 and 2008, though at a lower rate. There have been no cases alleging options backdating in 2009.
The months with the most filing activity recently were December 2008 and March 2009, both months when many cases related to Ponzi schemes were brought. Year-to-date in 2009, March has been the peak month for filings. In the second quarter, filings have gradually declined each month, with only 14 brought in June. See Figure 2.
Figure 2. Federal Filings: One-Month Intervals January 1, 2007 – June 30, 2009
Filings By Circuit
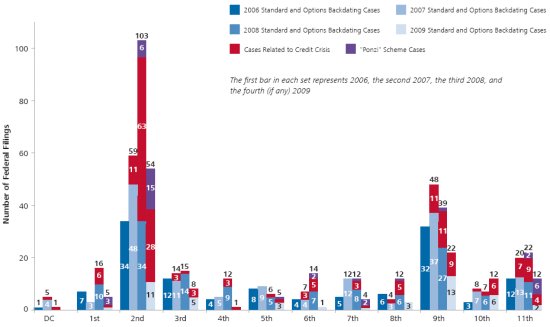
Historically, securities class action filings have been concentrated in the Second Circuit (including Connecticut, New York, and Vermont) and the Ninth Circuit (which includes California and certain other Western states and territories). While these two Circuits had relatively similar levels of filings in 2006 and 2007, in 2008 and 2009, filings have been massed in the Second Circuit. This is due to the heavy concentration of credit crisis-related filings clustered in the Second Circuit, and many cases alleging Ponzi schemes were also filed in this Circuit.
While credit crisis cases are focused in the Second Circuit, however, this is not the only area affected by credit crisis litigation. In fact, a credit crisis case has been brought in every Federal Circuit. See Figure 3.
Figure 3. Federal Filings By Circuit, Year, And Type Of Case January 1, 2006 – June 30, 2009
Filings By Sector
In the first half of 2009, filings have been concentrated against defendants in the finance sector.4 Over 60% of all cases brought this year name a finance sector defendant. This is a similar pattern to 2008, when more than 50% of the filings named financial companies as the primary defendant. See Figure 4. Unsurprisingly, these filings against companies in the finance sector are strongly correlated with the credit crisis.
Figure 4. Percentage Of Filings By Sector And Year January 1, 2005 – June 30, 2009
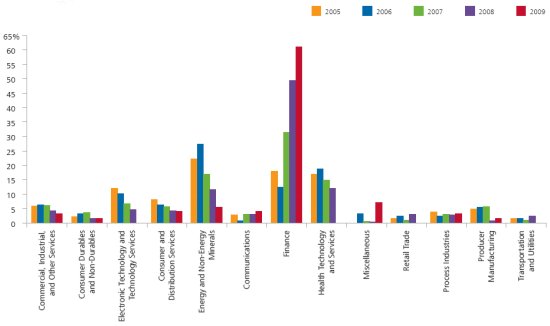
At the same time the percentage of all filings brought against finance companies was increasing during 2008 and 2009, the overall level of filings also increased (see Figures 1 and 4). So while the relative proportion of cases filed in other sectors decreased during this time period, the absolute level of filings in many of the other economic sectors has stayed level compared to the 2006-2007 period. For example, the consumer services, producer manufacturing and technology services sectors received similar numbers of filings in 2008 as in 2007, and all three sectors are on pace to receive similar levels of filings again in 2009.
Not only have an increasing percentage of complaints filed over the past three years named companies in the finance sector as primary defendants, but an increasing percentage of cases filed have named co-defendants in the finance sector as well. In the first half of 2009, 33% of all filings named a financial institution as a co-defendant, up from less than 10% in 2005. See Figure 5.
Figure 5. Cases In Which Financial Institutions Are Named Defendants As Percentage Of All Federal Filings January 1, 2005 – June 30, 2009
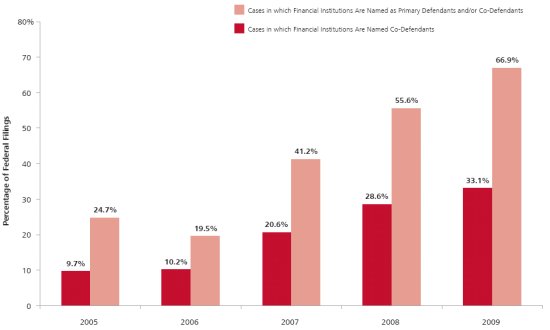
Some cases may name both a financial sector defendant and additional co-defendants that are also companies in the finance industry. If cases where financial institutions are named as either primary defendants and/or as co-defendants are combined, nearly 67% of cases filed in the first half of 2009 involve a financial institution defendant, as compared to approximately 25% of the cases filed in 2005. See Figure 5.
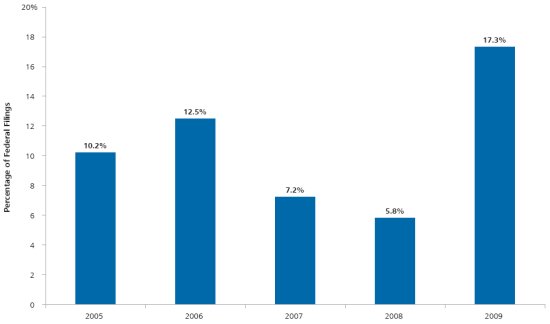
The percentage of cases naming an accounting firm as a co-defendant also increased in the first half of 2009, rising to 17%, the highest percentage in the past five years. The pattern of accounting co-defendant filings, however, is more varied than the financial institution co-defendant filings. At the start of the credit crisis in 2007, only 7% of cases had an accounting co-defendant named, and in 2008, less than 6% of cases named an accounting co-defendant. See Figure 6.
Figure 6. Cases In Which Accounting Firms Are Named Co-Defendants As Percentage Of All Federal Filings January 1, 2005 – June 30, 2009
Filings By Country Of Defendant
In the first half of 2009, 19 filings, or 15% of all cases filed, named a foreign company as a primary defendant—this is the highest percentage of foreign defendants ever observed post-PSLRA.5 See Figures 7 and 8.
Figure 7. Federal Filings Against US And Foreign Companies January 1, 1996 – June 30, 2009
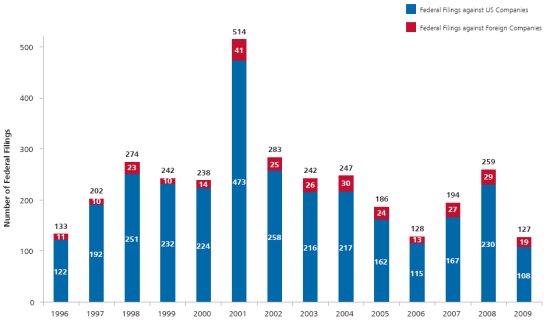
Figure 8. Proportion Of Federal Filings And Listed Companies That Involve Foreign Issuers January 1, 1996 – June 30, 2009
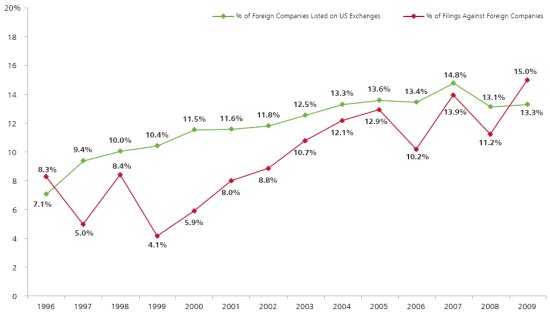
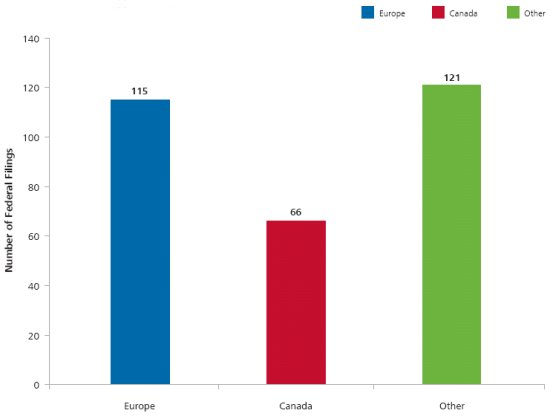
Over this 14-year period, there have been a total of 302 federal securities class action filings against foreign defendants. Canadian companies are the most frequently named, with 66 filings since 1996. One hundred and fifteen filings were brought against companies domiciled in Europe, with Swiss (27 filings) and UK (26 filings) companies receiving the most filings in this category. Some of the "Other" foreign companies in Figure 9 include "tax haven" countries like Bermuda, but China, with 42 filings, is also included in this group.
For the first time since 1996, the percentage of filings against foreign companies is greater than the number of foreign companies listed on US exchanges: so far in 2009, 15% of cases name a foreign defendant, but only 13% of companies traded on US markets are foreign.6 See Figure 8.
Figure 9. Filings By Region Of Company Domicile January 1, 1996 – June 30, 2009
Trends In Allegations
Class action cases filed in recent years contain a wide variety of allegations, and each case may have multiple allegations.7
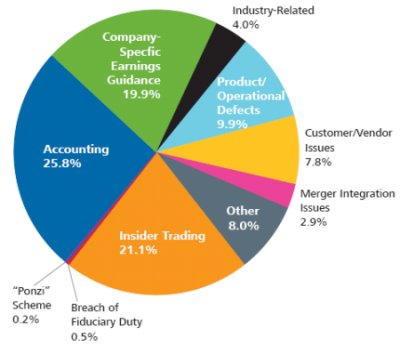
Prior to the credit crisis, in the 2005-2006 period, we found that almost 26% of allegations related to accounting, with another 20% related to company-specific earnings guidance. We also found that insider trading was frequently alleged, making up 21% of all allegations made in plaintiffs' complaints. See Figure 10.
Figure 10. Allegations In Federal Filings January 1, 2005 – December 31, 2006
During the era of the credit crisis, from 2007 through the first half of 2009, there has been a shift in the distribution of these allegation types (Figure 11). Accounting and earnings guidance-related allegations are still common, making up almost one-third of all allegations in complaints. Insider trading allegations have become less prevalent, on the other hand, and breach of fiduciary duty allegations have relatively increased from less than 1% up to 7% of the allegations made. This increase in breach of fiduciary duty claims is directly related to the wave of credit crisis and Ponzi scheme filings, in which plaintiffs' have claimed that they were misled about the quality or risk profile of various securities held or chosen by investment managers, custodians, or other facilitating agents.
Figure 11. Allegations In Federal Filings January 1, 2007 – June 30, 2009
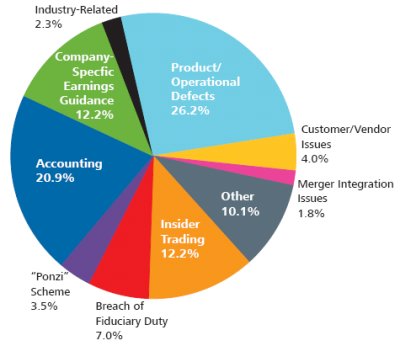
There has also been a relative increase in the product/operational defect category of allegations in the era of the credit crisis, as plaintiffs claim that financial products purchased were "defective" in some way.8 Ponzi scheme allegations have grown in importance as well, up to 3.5% of allegations in the 2007-2009 period from a tiny sliver of the allegation universe in 2005-2006. See Figures 10 and 11.
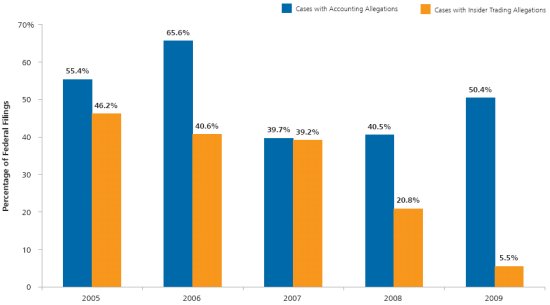
Not only have accounting allegations decreased as a percentage of all allegations during the recent credit crisis, but the percent of filings with an accounting allegation has also decreased over 2007-2009 as compared to 2005-2006: in 2005-2006, almost 60% of all filings had an accounting allegation, while from 2007-2008 slightly over 40% filings had an accounting allegation. Year-to-date in 2009, the percentage of cases with an accounting allegation has increased relative to the last two years, up to 50% of all filings. See Figure 12.
Figure 12. Cases With Accounting Or Insider Trading Allegations As Percentage Of All Federal Filings January 1, 2005 – June 30, 2009
Filings And Market Volatility
The recent tumultuous events surrounding the credit crisis and the revelation of Ponzi schemes have been major drivers of filings in 2008 and the first half of 2009. More generally, overall market performance and volatility have historically been associated with increases in filings activity.
One way to measure this correlation is the performance of the market as a whole, as represented by volatility and returns to the S&P 500 Index. Using quarterly data, we assessed each of these market performance measures, both individually and in combination.
First, we analyzed the quarterly relationship between market volatility and the number of federal securities class action filings. This relationship is depicted in Figure 13, where market volatility is measured as the annualized standard deviation of daily returns to the S&P 500 Index.9 We find a statistically significant positive correlation between quarterly market volatility and filings.
Figure 13. Quarterly Federal Filings vs. Volatility Of The S&P 500 Index 1Q 1996 Through 2Q 2009
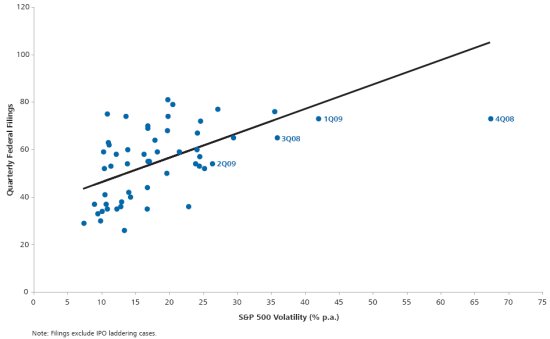
Next, we investigated the relationship between market returns and filings. Surprisingly, we find a small positive correlation there as well, with filings rising in the quarters where the index rose.
Controlling for market returns, volatility is positively and statistically significantly correlated with quarterly filings, over the quarters from first quarter 1996 through second quarter 2009. However, as can be seen from the plot in Figure 13, the relationship between volatility and filings is not tight.10 While filings seem to move with market volatility, controlling for market returns, the two variables together explain only approximately 28% percent of the variance in quarterly filings.
Time From Disclosure To Filing
Although market volatility is correlated with filings in the subsequent quarter, it only explains a small percentage of variation in filings. This is consistent with the observed pattern of the duration between the end of the class period alleged in the complaint—and typically the corresponding alleged corrective disclosure and price drop—and the date the first complaint is filed.
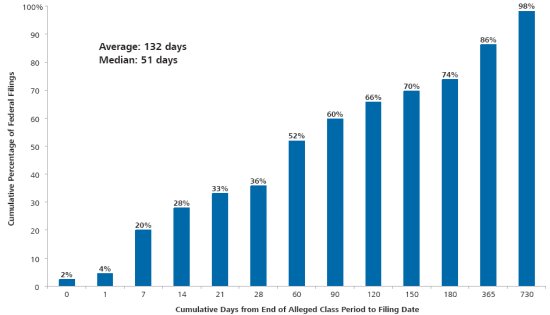
While the median case is filed less than two months after the end-of-class-period corrective disclosure (51 days), over 40% of cases are filed more than 90 days after the end of the class period. In fact, the average duration between the end of the alleged class period and the first complaint file date is 132 days, and only 20% are filed within the first week following the class period end date.11 See Figure 14.
Figure 14. Cumulative Percentage Of Federal Securities Class Action Filings By Number Of Days From End Of Class Period To First Filed Complaint January 1, 2007 – June 30, 2009
RESOLUTIONS
In addition to tracking trends in filings, NERA collects information about how securities class action cases are resolved. Of all post-PSLRA filings in our database that have been resolved, approximately 44% have been dismissed, and 56% have settled with all defendants, with only a very tiny fraction having reached a verdict at trial.12
Because cases may require more or less time to resolve, and because the probability of dismissal may vary at different stages of a case's life cycle, we examine resolution statistics in more detail in alternative ways below.
Resolution Of Cases By File Year
One way to look at patterns of resolutions is by file year, tracing a "cohort" of cases over the life of the litigation. To get a picture of the resolution rates for a mature cohort of cases—one where the cases have had time to work through the litigation process and ultimately resolve—we look at the distribution of the status of cases filed in 2000.
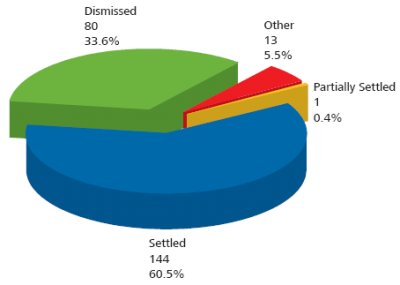
Of the 238 cases filed in 2000, over 60% have settled or have partially settled (i.e., at least one of the defendants in the case has settled). Another 34% have been (and remain) dismissed. Only about 6%, or 13, have not yet been resolved, and are either still pending or have been abandoned by plaintiffs. See Figure 15.
Figure 15. Status Of 238 Federal Securities Class Actions Filed In 2000
For the resolved cases filed in 2000, the average time to resolution was 2.9 years; for dismissals the average was 1.7 years, and for settlements, it was 3.5 years.
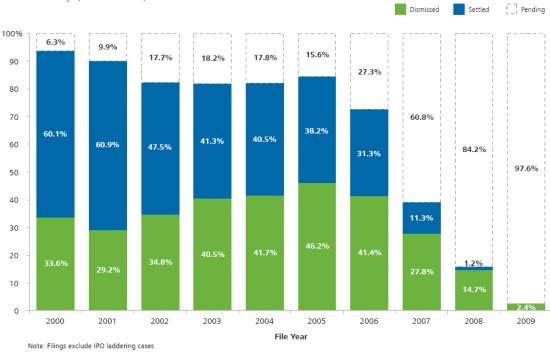
If we look at cases filed in more recent years, the mix of case status, i.e., whether the case is pending, dismissed, or resolved, differs from the cases filed in 2000. Most of the cases filed from 2007 through 2009 are still pending. Over 84% of cases filed between 2000 and 2006, on the other hand, have resolved. See Figure 16.
Figure 16. Status Of Cases As Percentage Of Federal Filings By File Year January 1, 2000 – June 30, 2009
Given the large number of cases related to the credit crisis in recent filings, much attention has been focused on the potential resolutions of these cases. But because most of these cases were filed in the last few years—consistent with the patterns noted above—they remain primarily unresolved. Over 90% of credit crisis cases are still pending. Only three credit crisis cases have been settled through June 30, 2009, with another 16, or approximately 8%, dismissed.
Probability Of Resolution By Age Of Case
Another way to look at patterns of resolutions is by the age of the case, i.e., by the number of years since the date of filing. Some cases will resolve quickly and be settled or dismissed in the same year as they are filed at age zero. Other cases may linger, remaining unresolved for many years.
Figure 17 shows the cumulative probabilities that cases will resolve, settle with all defendants, or dismiss as a function of the age of the claim, using data from 2000 to 2009.13 Long term, by the time they reach the age of nine years, over 90% of cases have resolved. In the early years of litigation, when cases are aged two years or less, they are more likely to dismiss than to settle. This is unsurprising, since motions to dismiss are typically brought at a relatively early stage in the litigation process.
Figure 17. Cumulative Probability Of Dismissal, Settlement, And Resolution January 1, 2000 – June 30, 2009
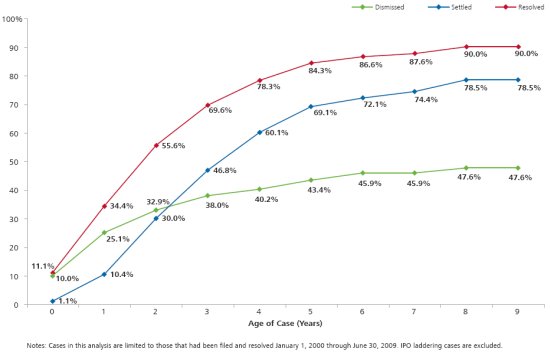
Over the longer horizon, this pattern reverses, and ultimately the probability of a case resolving in settlement is almost 65% larger than the probability it will be dismissed. Because of this pattern, i.e., that cases are more likely to dismiss than to settle in early years of the life of the litigation, the 44% of post-PSLRA resolved claims that have been dismissed is likely to be an overstatement of the ultimate dismissal rate for all filed claims.
Dismissal Rates For Resolved Claims, Pre- And Post-Dura
The Supreme Court's decision in Dura in April 2005 ruled that plaintiffs must show loss causation related to the alleged fraud in order to proceed with their claims.14 This increased the burden on plaintiffs, and may have made it easier for defendants to get cases dismissed.
Because, as shown above, it takes time for cases to move through the litigation process, it was difficult to measure the effect of the Dura decision on dismissal rates immediately following its passage.
Now that over four years of data have been collected since the decision, it is possible to start looking at some comparisons of aggregate statistics pre- and post-Dura to see if dismissal rates have changed since the time of the Supreme Court's ruling.
Figure 18 shows the fraction of resolved cases that are dismissed, by age of claim at time of resolution, for those claims resolved before and after the Dura decision. This figure includes all cases filed between January 2000 and June 2009 that resolved within four years from the time of filing.
Figure 18. Dismissed Cases As Percentage Of Resolved Cases By Age Of Case At Resolution Pre- And Post-Dura January 1, 2000 – June 30, 2009
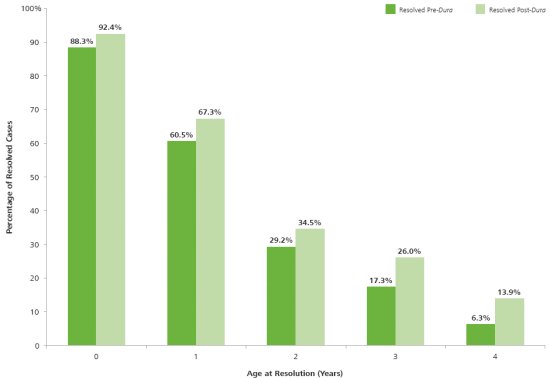
We find that, at every age, a slightly higher fraction of resolved cases have been dismissed after the ruling in Dura than before, consistent with the hypothesis that defendants may have been more likely to receive dismissals after the Supreme Court's decision. Both pre- and post-Dura, however, cases that resolve very quickly—at age one or less—are much more likely to dismiss than settle, which is consistent with the cumulative probability distributions shown in Figure 17.
Trials
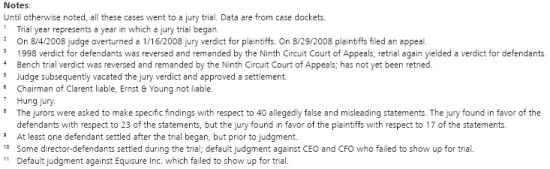
As mentioned above, very few securities class action cases result in a verdict at trial—the vast majority are settled or dismissed. Since the passage of the PSLRA, only 22 cases have gone to trial. Details of these 22 cases are presented in Table 1, including the Circuit in which the case was filed, along with file and trial years.
Table 1. Twenty-Two Securities Class Actions That Went To Trial After PSLRA
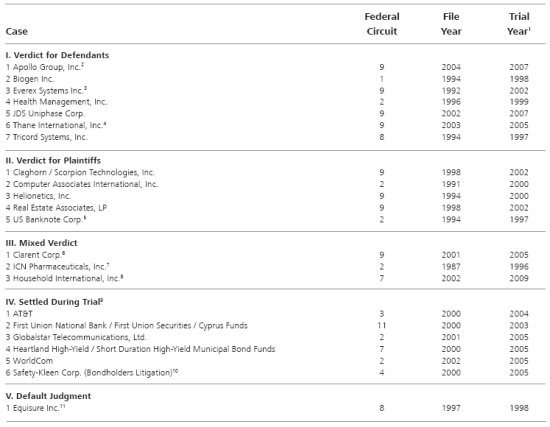
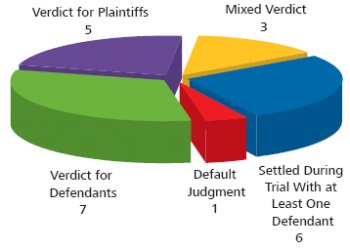
Cases that proceed to trial do not always result in a straight plaintiff or defense verdict. In some cases, one or more of the defendants may settle during the trial. In other instances, a clear plaintiff or defense verdict may be reached, only to be appealed and either to be reversed or sustained. Still other cases have resulted in a mixed verdict, a hung jury, or even a default judgment.
We have grouped the 22 shareholder class actions that went to trial after the PSLRA into mutually exclusive categories in Figure 19. A straight verdict was reached for the defense in six cases, while plaintiffs prevailed in six. Another six started trial only to have at least one defendant settle before a verdict was reached. Another three had mixed verdicts, and one case resulted in a default judgment.
Figure 19. Status Of Twenty-Two Securities Class Actions That Went To Trial After PSLRA
In 2009, one case, Household International Securities, reached a verdict in the liability phase of the trial. Plaintiffs filed this case in 2002, and alleged that the defendants engaged in a predatory lending scheme, allowing the company to inflate its financial and operational results. The jury in this case reached a mixed verdict, finding that some of the statements identified by the plaintiffs were false and misleading, but that others were not. The case is now set to move on to a second phase where damages will be determined.
Because the allegations in this case are related to lending practices, it is tempting to use the verdict to inform our expectations of how more recent credit crisis cases may play out at trial, but extrapolating from a sample of only one case to the credit crisis more generally is problematic, not least because many characteristics of the verdict are quite case-specific.
Given the history of securities class action litigation, it seems most likely that the majority of credit crisis cases—like other cases before them—will resolve before reaching trial. Both plaintiffs and defendants have incentives to settle to avoid the risks of an adverse verdict. In addition, a settlement avoids the potential risk of a finding of fraud by a judge or jury, which may invalidate the Directors and Officers (D&O) insurance policies held by most companies that would otherwise pay for some or all of a settlement amount.
Please click here to read the article and its footnotes in full
Footnotes
1. This edition of NERA's research on recent trends in shareholder class action litigation expands on previous work by our colleagues Lucy Allen, Elaine Buckberg, Frederick C. Dunbar, Todd Foster, Vinita M. Juneja, Denise Neumann Martin, Ronald I. Miller, and David I. Tabak. We gratefully acknowledge their contribution to previous editions as well as this current version. The authors also thank Jake George, Nicole Mody, Mary Elizabeth Stern, and Carl Vogel for helpful comments on earlier drafts of the paper. In addition, we thank Benjamin Berman, Nicole Roman, Carlos Soto, and many other NERA researchers for further assistance. These individuals receive credit only for improving this paper; all errors and omissions are ours.
2. Data on filings come from multiple sources, including RiskMetrics Group/Securities Class Action Services (SCAS), Factiva, Bloomberg, FactSet, SEC filings, and the public press. In compiling our data, we seek information on all unique class actions alleging damages with regard to the purchase, ownership, or sale of securities. Unless cases are consolidated, we report all filings potentially related to the same alleged fraud, if the complaints are filed in different Circuits or if different securities are alleged be affected by the fraud. If cases are ultimately consolidated, the data are adjusted.
3. See, for example, cases against NextWave Wireless Inc. filed in September 2008, cases against Perrigo Company and Pacific Investment Management Company LLC filed in March 2009, and cases against executives of MRU Holdings, Inc. filed in April 2009.
4. This analysis is based on the FactSet Research Systems, Inc. economic sector classification. Some of the FactSet economic sectors are combined in Figure 4 for presentation.
5. Foreign companies are defined as those whose country of domicile is not the United States.
6. Securities listed on NYSE, AMEX, and NASDAQ at the end of the period (source: Meridian Securities Markets LLC).
7. Most securities class action complaints have multiple allegations. All allegations are included in this analysis, such that the total number of allegations exceeds the total number of filings.
8. Specifically, 58.1% of the 2007-2009 product or operational defect allegations relate to financial products, and only 41.9% relate to non-financial product or operational defects.
9. Specifically, volatility is measured using the standard deviation of daily S&P 500 returns in each quarter, annualized by multiplying by the square root of 252.
10. We regressed quarterly filings on quarterly S&P 500 returns and quarterly S&P 500 volatility over the period from the first quarter of 1996 through the second quarter of 2009. Both independent variables are statistically significant at the 1% level. The R-squared of this regression is 0.31. Note that in the quarterly count of filings for this analysis, we did not include IPO laddering cases.
11. This analysis excludes cases where the number of days from the end of an alleged class period to the first filing date is more than 730 days, as well as cases without clear end of class period specified in the complaint.
12. Our dismissal statistics include summary judgments and verdicts for defendants, but exclude partial dismissals. Due to the nature of dismissal data, on one hand, our dismissal counts in this section may be slightly overstated because they may include some dismissals without prejudice that will be reversed by amended and better-pled complaints, dismissals with prejudice that will be successfully appealed, or cases that will settle after a dismissal without prejudice and before the expiration date for plaintiffs to re-file an amended complaint. On the other hand, dismissal counts may be slightly understated because we currently do not track dismissals with prejudice that subsequently settled or reverted to pending status. These two effects tend to offset one another.
13. More precisely, the data in Figure 17 shows the cumulative hazard rates of settlement, dismissal, and resolution, by age of claim, i.e., the probability that a claim will settle, dismiss, or resolve at a given age, conditional on surviving as a pending claim to that age.
14. See Dura Pharmaceuticals, Inc., et al. v. Broudo et al., 544 U.S. 336 (2005), in which the Supreme Court ruled that plaintiffs must show a link between alleged illegal activity and a drop in stock prices to survive a motion to dismiss. Justice Stephen G. Breyer wrote for the Court, "It should not prove burdensome for a plaintiff who has suffered an economic loss to provide a defendant with some indication of the loss and the causal connection that the plaintiff has in mind."
The content of this article is intended to provide a general guide to the subject matter. Specialist advice should be sought about your specific circumstances.