
As the prevalence of environmental, social and governance-related incentive metrics stabilizes, stakeholders are increasingly looking at the quality of these metrics.
Environmental, social and governance (ESG) metrics in executive incentive plans have become a common feature among public companies around the world, with regional and industry differences largely driven by various regulatory, investor and political pressures and sentiments.
Environmental, social and governance (ESG) metrics in executive incentive plans have become a common feature among public companies around the world, with regional and industry differences largely driven by various regulatory, investor and political pressures and sentiments.
Overall prevalence of ESG metrics
North America, Europe and Asia Pacific
81%
of companies use at least one ESG metric in their incentive
plans (short-term, long-term or both), +15% vs. 3 years
ago
77%
of companies use at least one ESG metric in their
short-term incentive plans, +14% vs. 3 years ago
29%
of companies use at least one ESG metric in their long-term
incentive plans, +16% vs. 3 years ago
Overall prevalence of ESG metrics, by region

Overall prevalence has remained broadly stable from last year, with the exception of a notable (7 percentage points) increase in ESG metric prevalence in European companies' LTI plans.
The greater use of ESG metrics in LTIs by European and UK companies is the most notable geographic difference. This reflects that environmental (particularly carbon/greenhouse gas (GHG) emissions reduction) metrics are most common in Europe, lending themselves to long-term measurement.
Moreover, compared to other regions, companies in Europe are generally more advanced in defining their net-zero commitments and interim targets due to regulation and investor expectations.
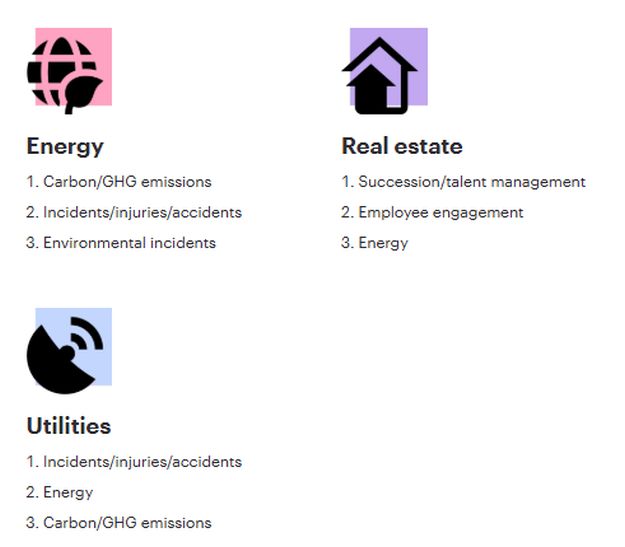
Metrics by industry
Industries with the highest prevalence of ESG metrics, global
There is variability in the ESG metrics used most commonly across industries, indicating that companies are, rightly, considering what's relevant for their industry and its place in the value chain when selecting metrics. Taking this a step further, investors are emphasizing the need to clearly see how ESG metrics are strategically material to the business (and shareholder value) when it comes to ESG metric selection.
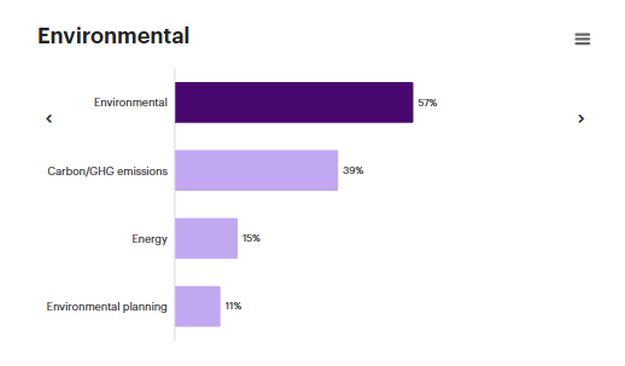
ESG categories and metrics
Prevalence of ESG categories and top 3 metrics across all plans, global
32% of carbon/GHG emissions metrics globally include scope 3 emissions. This is highest in Europe (37%), but not markedly so in comparison to North America (26%) and Asia Pacific (30%).
Prevalence of ESG categories and top 3 metrics, global
Move among environmental, social and governance categories by clicking on the right- and left-side arrows
Prevalence of ESG categories and top 3 metrics across all plans, by region
Despite pushback on corporate diversity, equity and inclusion (DEI) initiatives in the United States, there was not a significant change in the use of DEI metrics in executive incentive plans.
Overall prevalence declined by 1%, while six additional companies in the S&P 500 disclosed plans to remove DEI metrics in their upcoming executive compensation cycle.
Prevalence of ESG categories and top 3 metrics, North America
Move among environmental, social and governance categories by clicking on the right- and left-side arrows

Prevalence of ESG categories and top 3 metrics, Europe
Move among environmental, social and governance categories by clicking on the right- and left-side arrows

Prevalence of ESG categories and top 3 metrics, Asia Pacific
Move among environmental, social and governance categories by clicking on the right- and left-side arrows

Metrics measurement
Qualitative vs. quantitative measurement of ESG metrics
LTI plans tend to use more quantitative ESG metrics (70%) vs. STI plans (47%). GHG emissions, health and safety, environmental incidents, water and DEI tend to be measured quantitatively. Metrics around leadership, stakeholder relationships, culture, risk management and compliance tend to be measured qualitatively.
55%
of companies include standalone ESG metrics, 25% measure ESG using
a scorecard and 20% include ESG elements in a broader
scorecard

Typical weight of all ESG metrics, combined and individually, global
Weighting is largely consistent across regions, with the exception of a higher median overall weight on ESG metrics in Asia Pacific (27%).
20%
median overall weighting of ESG metrics in incentive
plans
5%
median weighting for an individual ESG metric
In LTI plans, standalone ESG metrics that are measured quantitatively tend to have a higher weighting (median 8%) than those that are measured qualitatively (median 5%). There is no discernible difference between quantitative and qualitative ESG metrics in STI plans.
Payout trends
ESG metrics vs. other metrics, North America and Europe
In North America, ESG and other non-financial metrics tend to see a slightly higher payout factor as a percentage of target opportunity when compared to financial metrics. For Europe, there were higher payouts for qualitative ESG metrics (116%) than quantitative (111%).

The average payout for carbon/GHG emissions – the most common ESG metric globally – is higher than the average payout of ESG metrics and financial metrics, at 135% of target for both North America and Europe. This could be driven by any combination of:
- High focus on and performance against emissions reduction targets
- Lack of stretch in target setting
- Challenges in emissions measurement (data and tracking)
135%
of target is the average payout for carbon/GHG metrics disclosed as
a percentage of target in STI plans in North America and
Europe
77%
of maximum is the average payout for GHG metrics disclosed as a
percentage of max in STI plans (relevant for UK
companies)
It is unsurprising to see stability in ESG metric prevalence levels compared to last year, given high levels across Europe and political sensitivities in North America. This year and looking ahead, the focus from the boardroom and investment community is on refining these metrics to ensure they are (1) material to business strategy and long-term value creation, (2) measurable and as robust as financial metrics, and (3) clearly defined and transparently disclosed.
Terms to know
- Carbon/GHG Emissions
Reduction of carbon emissions, CO2 emissions, greenhouse gas emissions. - Climate change
Generic category when disclosure lacks specification about the metric definition (e.g., environmental sustainability achievements, sustainability (in the context of environment), ecological footprints). - Community outreach
Metrics that focus on the community around the company (i.e., outreach, volunteering, donating, sponsoring). - Compliance
Metric may relate to compliance program improvement or follow up policies, procedures, training, reporting, or no significant non-compliance events. - Culture
Metrics that focus on fostering behaviors that promote culture, promoting culture of civic engagement, strengthen culture. - Employee engagement
Increase in/results from employee engagement index, opinion surveys, employee satisfaction rates. - Energy
Reduction in energy use, use of sustainable/renewable energy, measures to increase energy efficiency. - Environmental incidents
Metrics relating to prevention, control and mitigation of releases of hazardous material or energy from primary containment - e.g., oil spills, releasing toxic gas, Spill Intensity Rate. - Environmental planning
Establishment or modification of environmental improvement/sustainability plans/strategies/scorecards. - Environmental sustainability
Generic category when disclosure lacks specification about the metric definition (e.g., environmental sustainability achievements, sustainability (in the context of environment), ecological footprints). - Inclusion and diversity in management
Increasing/retaining representation (race, ethnicity, gender, etc.) of executives, leaders and managers. - Incidents/injuries/accidents
Safety incidents, illnesses, accidents and so on that involve employees and/or contractors. - Not disclosed
Has an ESG measure that is not further specified. - Retention
Goals related to employee retention/attrition (e.g., employee retention rate, employee turnover). - Risk management
Metrics relating to risk management governance, frameworks, culture, appetite, risk scorecards, implementation of audit recommendations, internal control systems. - Scope 3 emissions
Metrics that include scope 3 emissions in their definitions. Scope 3 refers to indirect emissions outside of Scope 2 emissions that occur in the value chain of the reporting entity, including both upstream and downstream emissions. There are 15 categories within Scope 3 as defined by the GHG Protocol. - Stakeholder relationship
Generic category to capture broad stakeholder relationship and engagement metrics (e.g., regulators, political stakeholders, government, industry associations, NGOs, suppliers). - Succession/talent management
Any metric dealing with executive succession or managing talent and recruitment. - Sustainability index
Company objective to be listed in a rating index or to be in the top part of any broad 3rd party (external) ESG/Sustainability index. - Water
Goals relating to clean water, (re)use of water, water consumption.
The content of this article is intended to provide a general guide to the subject matter. Specialist advice should be sought about your specific circumstances.


