

- within Criminal Law topic(s)
- in Canada
- with readers working within the Retail & Leisure industries
- with readers working within the Media & Information and Metals & Mining industries
- within Law Department Performance, Real Estate and Construction, Food, Drugs, Healthcare and Life Sciences topic(s)
Is your neighbourhood getting safer? Despite the general picture painted, there has been a slight decrease in overall crime numbers in the past 5 years across New South Wales, according to the Bureau of Crime Statistics and Research (BOCSAR). Interestingly, crime in NSW is higher in regional NSW than in Sydney.
With this research we uncover the five most common crimes in every suburb across NSW, revealing the cities in New South Wales with the least – and most – crime incidents and rates.
Discover how your suburb ranks with the interactive tables below.
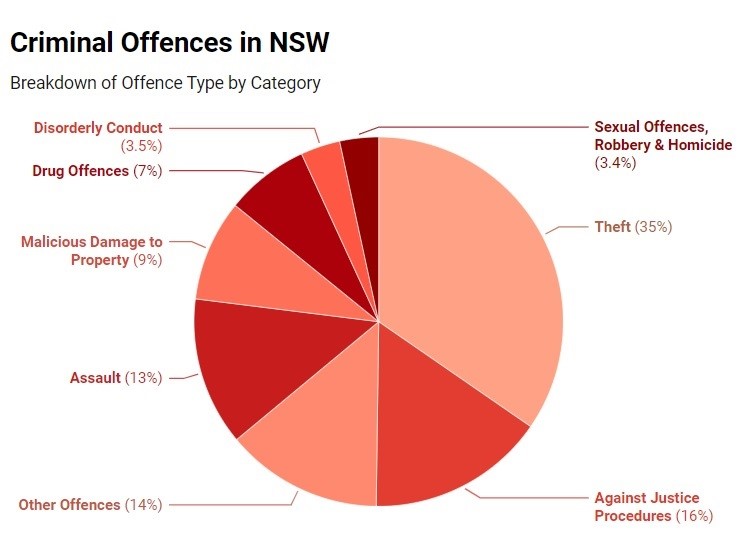
Most common criminal offences in NSW
Crime incident data from April 2023 - March 2024
(incl.)
Chart: Astor Legal
Overall, the most common crime in New South Wales is theft, with 35% of all criminal offences being a form of 'Theft'. The second most common crime at 16% is 'Against Justice Procedures', this includes acts or omissions occurring during justice processes and breaches of court-ordered sentencing.
The least common reported crimes in the state are 'Sexual Offences', 'Robbery' & Homicide', with only 3.4% of cases falling into these categories. Following this at 3.5% is 'Disorderly Conduct' which involves offensive language and conduct, trespassing and criminal intent.
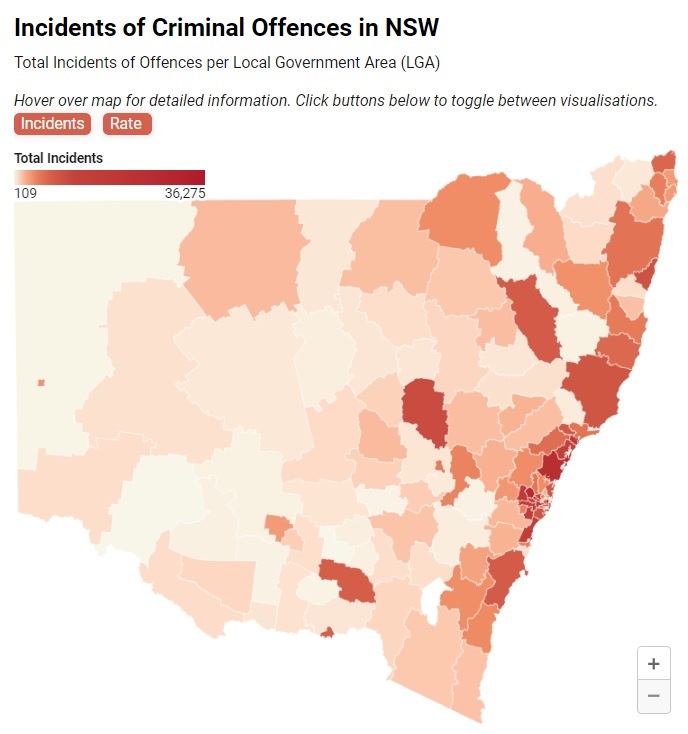
Total incidents of offences per LGA
Crime incident data from April 2023 - March 2024 (incl.).
Incidents are recorded by location of occurrence.
Map: Astor Legal
Criminal offence incidents are recorded at the place of occurrence, therefore offences like breaching bail conditions and theft from a retail store are more frequent in regional centres.
With that in mind, Sydney LGA holds the bottom spot, having the highest number of incidents of 36,275. The most common incident at 3,943 incidents, is 'Breaching Bail Conditions', followed by 'Non-Domestic Assault' with 2,921 incidents. Ranking second last is Blacktown LGA with a total of 27,542 incidents. Again, 'Breaching Bail Conditions' is the most common incident with 2,655 cases followed by 'Fraud' at 2,600 incidents. Central Coast LGA rounds out the bottom three, with a total of 25,155 incidents. The two most common crimes are 'Intimidation, Stalking & Harassment' which is only 10 incidents ahead of 'Breaching Bail Conditions'.
Balranald LGA in the Riverina area of western New South Wales is the LGA with the fewest offences with only 109 criminal incidents. 18 of these incidents are the 'Use & Possession of Cannabis', followed by 11 cases of 'Intimidation, Stalking & Harassment'. Coolamon LGA has the second fewest, with a total of 115 criminal offence incidents. The most common offence in Coolamon is 'Fraud' sitting at 16 incidents, followed by 'Malicious Damage to Property' with 13 incidents.
Rate of offences per LGA
The bottom ranking LGAs when analysing the rate per 100,000 people are located in more regional areas in the north and north west of the state, with Walgett, Moree Plains and Coonamble ranking bottom with a high offence rate per capita. 'Breaching Bail Conditions', 'Intimidation, Stalking & Harassment', 'Domestic Assault' and 'Malicious Damage to Property' are shared as common offences among these three LGA.
Despite its higher population density, Sydney remains in the bottom 10 with an incident rate of 16,632 per 100,000 population. Unsurprisingly, 'Steal from Retail Store' and 'Non-Domestic Assault' are among the most common here as a central shopping and nightlife district.
All located in Sydney's North Shore, Ku-Ring-Gai, Mosman and Lane Cove could be regarded as the three safest LGAs in terms of incident rate, all with less than 2,500 incidents per 100,000 in population over the year. Although infrequent, 'Fraud', 'Malicious Damage to Property' and 'Intimidation, Stalking & Harassment' are shared as the most common among these LGAs.
LGAs in NSW with the Lowest Crime Rate
| LGA | Total Incidents | Rate per 100,000 Population | Rate Rank | |
|---|---|---|---|---|
| 1 | Albury | 7,258 | 12,808 | 109 |
| 2 | Armidale Regional | 3,572 | 12,166 | 103 |
| 3 | Ballina | 3,084 | 6,583 | 54 |
| 4 | Bathurst Regional | 4,202 | 9,525 | 82 |
| 5 | Bayside | 8,360 | 4,698 | 29 |
| 6 | Bega Valley | 1,535 | 4,265 | 26 |
| 7 | Bellingen | 845 | 6,372 | 50 |
| 8 | Berrigan | 603 | 6,968 | 63 |
| 9 | Blacktown | 27,542 | 6,703 | 60 |
| 10 | Bland | 558 | 10,157 | 85 |
| 11 | Blayney | 416 | 5,480 | 38 |
| 12 | Blue Mountains | 3,203 | 4,111 | 23 |
| 13 | Broken Hill | 3,369 | 19,176 | 117 |
| 14 | Burwood | 2,606 | 6,383 | 51 |
| 15 | Byron | 3,033 | 8,306 | 75 |
| 16 | Cabonne | 514 | 3,712 | 15 |
| 17 | Camden | 4,308 | 3,371 | 12 |
| 18 | Campbelltown | 15,852 | 8,789 | 80 |
| 19 | Canada Bay | 3,003 | 3,367 | 11 |
| 20 | Canterbury-Bankstown | 19,881 | 5,343 | 36 |
| 21 | Central Coast | 25,155 | 7,204 | 68 |
| 22 | Cessnock | 5,781 | 8,775 | 79 |
| 23 | Clarence Valley | 5,366 | 9,817 | 84 |
| 24 | Cobar | 460 | 11,369 | 99 |
| 25 | Coffs Harbour | 9,031 | 11,328 | 98 |
| 26 | Coolamon | 115 | 2,576 | 5 |
| 27 | Coonamble | 841 | 21,987 | 118 |
| 28 | Cootamundra-Gundagai | 852 | 7,471 | 70 |
| 29 | Cowra | 1,228 | 9,666 | 83 |
| 30 | Cumberland | 14,627 | 6,161 | 47 |
| 31 | Dubbo Regional | 9,985 | 17,864 | 116 |
| 32 | Dungog | 399 | 4,105 | 22 |
| 33 | Edward River | 1,054 | 12,463 | 106 |
| 34 | Eurobodalla | 3,878 | 9,516 | 81 |
| 35 | Fairfield | 11,619 | 5,619 | 42 |
| 36 | Federation | 675 | 5,251 | 34 |
| 37 | Forbes | 1,163 | 12,453 | 105 |
| 38 | Georges River | 6,164 | 4,023 | 20 |
| 39 | Gilgandra | 504 | 11,724 | 101 |
| 40 | Glen Innes Severn | 975 | 10,900 | 94 |
| 41 | Goulburn Mulwaree | 2,725 | 8,402 | 76 |
| 42 | Greater Hume Shire | 505 | 4,483 | 27 |
| 43 | Griffith | 3,041 | 11,258 | 97 |
| 44 | Gunnedah | 1,708 | 12,996 | 110 |
| 45 | Gwydir | 243 | 4,935 | 31 |
| 46 | Hawkesbury | 3,740 | 5,511 | 40 |
| 47 | Hilltops | 1,519 | 7,895 | 72 |
| 48 | Hornsby | 3,800 | 2,504 | 4 |
| 49 | Hunters Hill | 402 | 2,886 | 7 |
| 50 | Inner West | 10,986 | 6,000 | 45 |
| 51 | Inverell | 2,247 | 12,506 | 107 |
| 52 | Junee | 299 | 4,625 | 28 |
| 53 | Kempsey | 4,758 | 15,260 | 112 |
| 54 | Kiama | 705 | 3,070 | 8 |
| 55 | Ku-Ring-Gai | 2,101 | 1,693 | 1 |
| 56 | Kyogle | 468 | 4,950 | 32 |
| 57 | Lachlan | 962 | 15,670 | 113 |
| 58 | Lake Macquarie | 13,357 | 6,166 | 48 |
| 59 | Lane Cove | 1,000 | 2,495 | 3 |
| 60 | Leeton | 1,196 | 10,442 | 87 |
| 61 | Lismore | 4,514 | 10,195 | 86 |
| 62 | Lithgow | 2,178 | 10,465 | 88 |
| 63 | Liverpool | 15,975 | 6,663 | 58 |
| 64 | Liverpool Plains | 506 | 6,606 | 55 |
| 65 | Lockhart | 179 | 5,312 | 35 |
| 66 | Maitland | 7,926 | 8,466 | 77 |
| 67 | Mid-Coast | 8,444 | 8,683 | 78 |
| 68 | Mid-Western Regional | 1,712 | 6,636 | 56 |
| 69 | Moree Plains | 3,748 | 29,124 | 119 |
| 70 | Mosman | 698 | 2,482 | 2 |
| 71 | Murray River | 866 | 6,653 | 57 |
| 72 | Murrumbidgee | 241 | 6,758 | 61 |
| 73 | Muswellbrook | 2,058 | 12,443 | 104 |
| 74 | Nambucca Valley | 1,622 | 7,870 | 71 |
| 75 | Narrabri | 1,396 | 10,974 | 95 |
| 76 | Narrandera | 806 | 14,088 | 111 |
| 77 | Narromine | 1,135 | 17,652 | 115 |
| 78 | Newcastle | 18,210 | 10,615 | 90 |
| 79 | North Sydney | 2,386 | 3,440 | 14 |
| 80 | Northern Beaches | 8,494 | 3,227 | 9 |
| 81 | Oberon | 236 | 4,217 | 24 |
| 82 | Orange | 4,791 | 10,899 | 93 |
| 83 | Parkes | 1,802 | 12,560 | 108 |
| 84 | Parramatta | 16,665 | 6,401 | 52 |
| 85 | Penrith | 18,032 | 8,163 | 73 |
| 86 | Port Macquarie-Hastings | 6,184 | 7,003 | 65 |
| 87 | Port Stephens | 5,318 | 6,936 | 62 |
| 88 | Queanbeyan-Palerang Regional | 3,676 | 5,724 | 43 |
| 89 | Randwick | 8,318 | 6,131 | 46 |
| 90 | Richmond Valley | 2,486 | 10,489 | 89 |
| 91 | Ryde | 4,395 | 3,352 | 10 |
| 92 | Shellharbour | 4,585 | 5,853 | 44 |
| 93 | Shoalhaven | 7,788 | 7,106 | 66 |
| 94 | Singleton | 1,672 | 6,663 | 58 |
| 95 | Snowy Monaro Regional | 1,346 | 6,169 | 49 |
| 96 | Snowy Valleys | 1,072 | 7,177 | 67 |
| 97 | Strathfield | 2,502 | 5,413 | 37 |
| 98 | Sutherland Shire | 8,649 | 3,731 | 16 |
| 99 | Sydney | 36,275 | 16,632 | 114 |
| 100 | Tamworth Regional | 7,724 | 11,971 | 102 |
| 101 | Temora | 329 | 5,487 | 39 |
| 102 | Tenterfield | 765 | 11,121 | 96 |
| 103 | The Hills Shire | 5,249 | 2,635 | 6 |
| 104 | Tweed | 6,346 | 6,478 | 53 |
| 105 | Upper Hunter Shire | 738 | 5,163 | 33 |
| 106 | Upper Lachlan Shire | 336 | 3,929 | 18 |
| 107 | Uralla | 255 | 4,260 | 25 |
| 108 | Wagga Wagga | 7,291 | 10,669 | 91 |
| 109 | Walcha | 249 | 8,272 | 74 |
| 110 | Walgett | 1,694 | 30,711 | 120 |
| 111 | Warrumbungle Shire | 1,060 | 11,464 | 100 |
| 112 | Waverley | 4,850 | 6,996 | 64 |
| 113 | Weddin | 202 | 5,589 | 41 |
| 114 | Wentworth | 816 | 10,741 | 92 |
| 115 | Willoughby | 3,045 | 4,035 | 21 |
| 116 | Wingecarribee | 2,058 | 3,897 | 17 |
| 117 | Wollondilly | 1,908 | 3,420 | 13 |
| 118 | Wollongong | 15,722 | 7,264 | 69 |
| 119 | Woollahra | 2,106 | 3,936 | 19 |
| 120 | Yass Valley | 821 | 4,724 | 30 |
Crime incident data from April 2023 - March 2024
(incl.). Overall rate is calculated from ABS population data as
yearly rate per 100,000 population. Rates for LGAs of populations
less than 3,000 are not computed as rates can be unreliable and
have been excluded from this table.
Table: Astor Legal
NSW top LGA per criminal offence
Criminal Offences in NSW and Top LGAs
Most common offences by total number
| Offence | Category | Total Offences | LGA Most Incidents | # Incidents | LGA Highest Rate | Rate p/100,000 | |
|---|---|---|---|---|---|---|---|
| 1 | Breach Bail Conditions | Against Justice Procedures | 54,042 | Campbelltown | 4,260 | Walgett | 4,279 |
| 2 | Malicious Damage to Property | Malicious Damage to Property | 49,367 | Blacktown | 2,490 | Moree Plains | 2,704 |
| 3 | Intimidation, Stalking and Harassment | Other Offences | 46,146 | Central Coast | 2,822 | Walgett | 3,934 |
| 4 | Fraud | Theft | 46,058 | Blacktown | 2,600 | Sydney | 1,137 |
| 5 | Domestic Assault | Assault | 36,501 | Blacktown | 2,171 | Walgett | 3,571 |
| 6 | Non-Domestic Assault | Assault | 33,292 | Sydney | 2,921 | Walgett | 1,595 |
| 7 | Steal From Motor Vehicle | Theft | 28,648 | Newcastle | 1,853 | Forbes | 1,927 |
| 8 | Steal From Retail Store | Theft | 27,420 | Sydney | 2,662 | Moree Plains | 1,306 |
| 9 | Breach AVO | Against Justice Procedures | 24,345 | Central Coast | 1,353 | Walgett | 2,774 |
| 10 | Other Theft | Theft | 20,665 | Sydney | 2,859 | ||
| 11 | Break and Enter Dwelling | Theft | 20,340 | Newcastle | 1,002 | Moree Plains | 2,277 |
| 12 | Steal From Dwelling | Theft | 16,093 | Sydney | 1,042 | Narromine | 684 |
| 13 | Motor Vehicle Theft | Theft | 14,516 | Blacktown | 752 | Moree Plains | 1,080 |
| 14 | Prohibited and Regulated Weapons Offences | Other Offences | 14,277 | Sydney | 890 | Walgett | 961 |
| 15 | Use/Possess Cannabis | Drug Offences | 14,062 | Sydney | 1,278 | Walgett | 852 |
| 16 | Trespass | Disorderly Conduct | 12,322 | Sydney | 746 | Moree Plains | 1,787 |
| 17 | Sexual Assault | Sexual Offences | 9,049 | Central Coast | 469 | Moree Plains | 544 |
| 18 | Break and Enter Non-Dwelling | Theft | 8,617 | Newcastle | 402 | Coonamble | 1,124 |
| 19 | Receiving/Handling Stolen Goods | Theft | 7,861 | Sydney | 1,167 | Sydney | 535 |
| 20 | Sexual Touching, Sexual Act and Other Sexual Offences | Sexual Offences | 7,788 | Sydney | 408 | Warrumbungle Shire | 433 |
| 21 | Liquor Offences | Other Offences | 6,822 | Sydney | 1,304 | Snowy Monaro Regional | 921 |
| 22 | Use/Possess Amphetamines | Drug Offences | 6,533 | Sydney | 582 | Narrandera | 455 |
| 23 | Use/Possess Other Drugs | Drug Offences | 5,555 | Sydney | 684 | Narrandera | 350 |
| 24 | Other Drug Offences | Drug Offences | 5,275 | Liverpool | 522 | Narrandera | 280 |
| 25 | Resist/Hinder Officer | Against Justice Procedures | 5,221 | Sydney | 599 | Walgett | 526 |
| 26 | Arson | Other Offences | 4,571 | Central Coast | 194 | Moree Plains | 1,049 |
| 27 | Offensive Conduct | Disorderly Conduct | 3,089 | Sydney | 726 | Sydney | 333 |
| 28 | Criminal Intent | Disorderly Conduct | 2,801 | Sydney | 271 | Coonamble | 392 |
| 29 | Assault Police | Assault | 2,548 | Sydney | 308 | Walgett | 381 |
| 30 | Other Offences Against Justice Procedures | Against Justice Procedures | 2,200 | Blacktown | 150 | Albury | 115 |
| 31 | Use/Possess Cocaine | Drug Offences | 2,191 | Sydney | 511 | Sydney | 234 |
| 32 | Steal From Person | Theft | 2,174 | Sydney | 510 | Sydney | 234 |
| 33 | Blackmail and Extortion | Other Offences | 1,672 | Blacktown | 109 | Walgett | 91 |
| 34 | Deal/Traffic Amphetamines | Drug Offences | 1,578 | Central Coast | 365 | Lake Macquarie | 116 |
| 35 | Other Offences Against the Person | Other Offences | 1,566 | Central Coast | 102 | Edward River | 130 |
| 36 | Pornography Offences | Other Offences | 1,192 | Blacktown | 65 | Snowy Valleys | 127 |
| 37 | Use/Possess Narcotics | Drug Offences | 1,181 | Fairfield | 221 | Fairfield | 107 |
| 38 | Robbery Without a Weapon | Robbery | 1,115 | Sydney | 130 | Moree Plains | 93 |
| 39 | Offensive Language | Disorderly Conduct | 1,065 | Sydney | 109 | Edward River | 166 |
| 40 | Use/Possess Ecstacy | Drug Offences | 1,002 | Sydney | 239 | Byron | 126 |
| 41 | Deal/Traffic Cocaine | Drug Offences | 980 | Sydney | 255 | Sydney | 117 |
| 42 | Fail to Appear | Against Justice Procedures | 859 | Cumberland | 66 | Walcha | 266 |
| 43 | Robbery With a Weapon Not Firearm | Robbery | 724 | Sydney | 57 | Moree Plains | 86 |
| 44 | Cultivating Cannabis | Drug Offences | 652 | Mid-Coast | 26 | Kyogle | 148 |
| 45 | Deal/Traffic Cannabis | Drug Offences | 509 | Central Coast | 52 | Hilltops | 73 |
| 46 | Deal/Traffic Other Drugs | Drug Offences | 437 | Sydney | 86 | Sydney | 39 |
| 47 | Abduction and Kidnapping | Other Offences | 258 | Sydney | 23 | Narromine | 31 |
| 48 | Deal/Traffic Narcotics | Drug Offences | 242 | Sydney | 74 | Sydney | 34 |
| 49 | Deal/Traffic Ecstacy | Drug Offences | 236 | Sydney | 57 | Hilltops | 68 |
| 50 | Stock Theft | Theft | 227 | Snowy Monaro Regional | 10 | Walgett | 109 |
| 51 | Escape Custody | Against Justice Procedures | 134 | Sydney | 11 | Parkes | 21 |
| 52 | Importing Drugs | Drug Offences | 109 | Bayside | 27 | Bayside | 15 |
| 53 | Robbery With a Firearm | Robbery | 101 | Canterbury-Bankstown | 12 | Gilgandra | 23 |
| 54 | Murder | Homicide | 64 | ID | 4 | Narrabri | 8 |
| 55 | Manufacture Drug | Drug Offences | 57 | Georges River | 5 | Broken Hill | 6 |
| 56 | Betting and Gaming Offences | Other Offences | 42 | Sydney | 16 | Tenterfield | 44 |
| 57 | Prostitution Offences | Other Offences | 21 | Sydney | 3 | Mid-Western Regional | 4 |
| 58 | Attempted Murder | Homicide | 15 | Canterbury-Bankstown | 3 | Upper Lachlan Shire | 12 |
| 59 | Manslaughter | Homicide | 12 | Bayside | 2 | Snowy Monaro Regional | 5 |
| 60 | Murder Accessory, Conspiracy | Homicide | 3 | Bayside | 1 | Bayside | 1 |
Crime incident data from April 2023 - March 2024
(incl.). Incidents are recorded by location of occurrence. Overall
rate is calculated from ABS population data as yearly rate per
100,000 population.
Table: Astor Legal
The most common offence in New South Wales is 'Breaching Bail Conditions' where Campbelltown has the highest number of incidents of 4,260 and Walgett has the highest rate per 100,000 people resulting in 4,279 incidents. 'Malicious Damage to Property' is the second most common offence with Blacktown LGA having the highest number of incidents of 2,490 and Moore Plains holds the highest rate resulting in 2,704 incidents.
The least common offence is murder accessory, conspiracy with a total of 3 offences. 'Manslaughter' is the second least common offence, with a total of 12 incidents. Interestingly, Bayside LGA has the highest number of incidents for 3 of the 10 least common crimes in the state, 'Murder Accessory, Conspiracy', 'Manslaughter' and 'Importing Drugs'.
Theft is the most common category of crime in New South Wales, with 4 of the top 10 criminal offences in the state falling into the 'Theft' category. The least common category is 'Homicide', where 4 of the bottom 10 offences fall into this category.
About the data
The data used for this study was obtained from the NSW Bureau of Crime Statistics and Research (BOCSAR) for crime incident data from April, 2023 – March, 2024 inclusive. The incidents are recorded by the Local Government Area (LGA) of occurrence. The information on this page was checked by criminal lawyers in Sydney before being published.
The rate per 100,000 population illustrates the relative crime per head of residential population for each LGA over the course of a year. This is computed by dividing the number of recorded incidents by the residential population for each area. Rates are calculated using population data provided by Australian Bureau of Statistics (ABS).
LGAs with populations of less than 3000 are hatched because their recorded crime rate can be unreliable. In areas with small populations, a modest number of incidents/victims/offenders can have a large effect on the calculated crime rate thus giving a misleading representation of crime in that location. Rates should also be treated cautiously for regions with high visitor numbers relative to the residential population: a particular issue for the Sydney city centre.
State rankings are based on the total number of LGAs available for comparison for incidents and rate per 100,000 population.
The content of this article is intended to provide a general guide to the subject matter. Specialist advice should be sought about your specific circumstances.
[View Source]