MEDIA
Television's "Super Media" Status Strengthens
Deloitte predicts that in 2011 television will solidify its status as the current super media, defying some commentators' prophecies of imminent obsolescence97. Viewers around the world will watch 140 billion more hours of television, revenues from pay TV in the BRIC98 countries will rise by 20 percent99; worldwide TV advertising will increase by $10 billion, 40 million new viewers will be added; TV chefs will sell tens of millions more cookbooks than their non-televised peers100; TV shows will be the most common conversation topic around the world and the subject of more than a billion tweets101. In short, television will likely continue to command a growing share of the world's attention and pocketbooks.
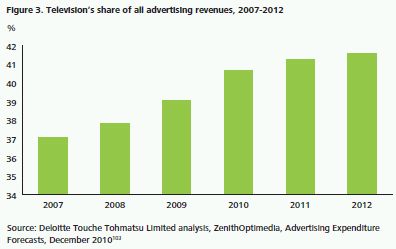
Deloitte expects television to retain its leadership among all media in terms of total revenues, which include advertising sales, subscriptions, pay-per-view, and license fees. Television's strength as an advertising medium is likely to be once again proven by a second year of solid growth and a fifth consecutive year of increased share of advertising revenue (see Figure 3). Television's five-year growth in advertising revenue, from $174 billion in 2007 to $191 billion in 2011, contrasts sharply with newspapers' decline in advertising revenue from $126 billion to $93 billion over the same period. A forecast 6 percent increase in 2012 would take TV advertising revenue beyond the $200 billion mark: more than twice as much as for newspapers, the number two advertising medium102. Forecast TV advertising revenues for 2011 should discourage any lingering doubts that the 30 second spot is in structural decline.
Deloitte also expects television to grow its share of audience attention, despite competition from many other existing and emerging distractions – both online and offline. In 2011, aggregate television viewing will likely reach 4.49 trillion hours. The global television audience is expected to grow by 40 million to 3.7 billion viewers; yet half of the world's population will remain untapped, leaving significant headroom for the television market to grow. Viewing per person is forecast to rise modestly to 3 hours and 12 minutes per day. This compares very favorably to the 15 minutes per day per member spent on social network sites104, and to the 33 minutes per day spent on the Internet per U.S. citizen105.
Television is likely to retain its status as the media that most powerfully influences content creation in other media sectors. Television should remain, for example, a key driver of the book trade. Bestseller lists will likely be well represented by television celebrities and television chefs106. Television is also likely to drive tens of millions of magazine sales, including magazines whose principal purpose is to provide a printed TV schedule. In the UK, a country with 23 million households, sales of TV listings magazines are likely to reach several million copies per week107. Television should also remain a key sales driver of children's toys around the world: Thomas the Tank Engine is the number one pre-school toy in China108. And it seems fair to assume that some of the best-selling music artists of 2011 will have been part of a televised talent contest109. In today's world, TV is the medium around which all others revolve.
Television's "super media" status is further reinforced by its impressive ability to sustain momentum.
For example, the most successful global TV franchise, Strictly Come Dancing, currently reaches 250 million viewers in 38 markets110. This leaves scores of countries and more than 3 billion potential new viewers for television to target. China is of particular interest, as Chinese consumers have just begun to purchase various formats of television content in earnest111. In 2011, Chinese broadcasters may become increasingly enthusiastic about new formats as a means to compete against Internet television112. Creating local variants of formats that have succeeded in other markets may be a way to win back viewers who had turned to the Web for the content they wanted to watch113.
Television seems to be gaining popularity in emerging markets. In 2011, TV advertising spend is expected to grow 16 percent in China and 14 percent in India114. In the BRIC countries, in 2011 pay TV revenues are forecast to rise by 20 percent to over $17 billion115.
All the while, television technology continues to improve. The steady migration to high definition should provide significant opportunities for up-selling to premium television subscribers. The growing penetration of large flat-panel televisions should increase the visual impact of programing and advertising (in effect, 50-inch digital billboards within our homes are proliferating). Also, 3D technology may provide an additional revenue stream in the medium to long term.
|
Bottom Line Television's overall trajectory looks to be strong in 2011 and, most likely, for a few years beyond. But allocation of the industry's spoils may vary widely for different players. The outlook for smaller content producers could be challenging. These companies lack the scale and reach to launch global formats. They may even struggle to upgrade to high definition (HD) production, which could be a major problem if HD becomes the new table stakes for earning a share of subscription revenues. Consumers' growing expectation for HD quality may also make life difficult for terrestrial broadcasters whose typical spectrum allocation only enables them to offer a handful of HD channels. By contrast, the growth of HD strengthens the hand of cable, satellite and certain telecommunications providers. In developing countries, one of the key challenges is likely to be how to increase revenues. A television subscription that only costs a few dollars a month might sound like exceptionally good value to U.S. subscribers accustomed to paying much more. But to consumers in developing countries, it can represent a huge portion of their income. Technological innovation has so far seemed to bolster the television sector; for example, DVRs and online TV content have tended to boost overall viewing. But as technological innovation increasingly drives viewers to consume multiple media simultaneously, its ultimate impact is unclear. It might reduce the attention paid to advertising. Or it might make television advertising even more powerful, by enabling viewers to take immediate action on their buying impulses. As for other forms of media, television could prove to be a significant enabler – both directly (through advertising) and indirectly (as a source of new ideas, celebrities and content). Other media sectors should look for creative ways for television to help sell their products. For example, a TV documentary of a band rehearsal could help promote a forthcoming tour. The music sector might also find television to be a growing source of direct revenues from licensing songs for use in commercials and TV programs. |
DVRs Proliferate! The 30 Second Spot Doesn't Die!
Deloitte predicts that digital video recorder (DVR) penetration in two large markets will exceed 50 percent of TV households by year-end 2011116; but also predicts that TV advertising will be almost entirely unaffected despite that level of penetration. While DVRs provide the technological capacity to skip ads, the majority of DVR owners are likely to continue watching the vast majority of their television live. TV ad rates may go up or may go down for various reasons this year but DVR penetration probably won't be one of them.
A decade ago, as DVRs became more affordable and widely adopted, industry commentators claimed that the television commercial was in trouble117. Their reasoning was that as DVR owners could readily fast forward through all advertisements, this would reduce the value of TV advertising118. Initial surveys of DVR owners tended to bear this out: self-reported ad-skipping was high119.
Whether or not ad-skipping was as high as was being claimed, the DVR threat remained only potentially devastating while very few viewers owned them. This remained the case for the first half of last decade: DVR ownership was only 17 percent in the United States in 2006120.
However, DVR ownership in many major television markets took off in the last five years. The falling prices of DVRs have enabled existing pay TV broadcasters to subsidize the entirety of their cost for a growing proportion of their customer base; new pay TV entrants have typically had no option but to offer a DVR to attract customers. DVRs have also entered homes "through the back door", via the tens of millions of hard-drive equipped games consoles possessing full DVR functionality that have shipped in recent years. And the price of non-subsidized DVRs has been dropping steadily to the point where entry models are available for $100121.
The growth trajectory in DVR ownership suggests that penetration among television owners in the United States and United Kingdom should cross 50 percent in 2011-2012 making it theoretically possible for half of all households in these markets to avoid television commercials altogether.
However Deloitte's view is that the DVR, even in markets where the devices are in the majority of homes, is unlikely to have a material impact on the value of television advertising in 2011122. This is principally because the majority of viewing in these households will be "appointment to watch" television, be this sports, a talent show, a soap opera, reality TV, a game show or a news bulletin. This type of programing usually crowds out time available to watch pre-recorded content.
Further, viewers are likely to attach increasing value to "first broadcast programing" in the next few years as the volume of social commentary, both that occurring organically as well as that encouraged by the broadcaster, steadily grows123: viewers are likely to become even more locked into the schedule and therefore less able to skip advertising124.
The 15-25 percent of programming that is fast forwarded through is not necessarily a squandered resource. Studies show that even ads viewed at 12x speed are still retained by viewers, and by including more distinctive imagery advertisers can further enhance the impact of fast-forwarded ads125. Programs that have a higher incidence of pre-recording (often programming targeted at younger audiences), advertising at the end of breaks can be sold at a premium as recall for such slots is likely to be highest126: fast forwarders will be concentrating hard to spot the last commercial to ensure they do not miss the resumption of the program.
These trends notwithstanding, there are likely to be some programs that are watched mainly on a pre-recorded basis, just as there will be some DVR owners who only watch pre-recorded content. But such programming and such behavior will not represent the mainstream. The type of programming that is watched mostly pre-recorded will typically be non-mainstream content scheduled outside of peak hours127. DVR owners who watch everything pre-recorded are likely to be individuals who watch just a few hours of content per week, rather than the typical average of 25-35 hours per week128.
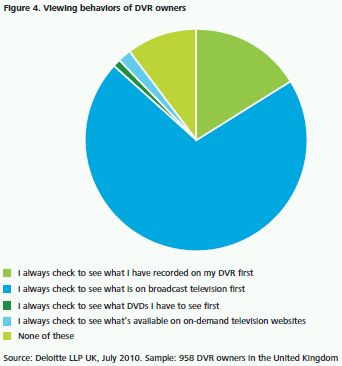
In 2011 (and beyond) DVR owners are likely to default to the schedule when turning on the television, and only resort to the menu of pre-recorded content after a few minutes of channel surfing have proved fruitless129. In one study of DVR owners in the United Kingdom, 70 percent always checked to see what was on broadcast first; only 16 percent checked out their pre-recorded options first (see Figure 4).
In 2011 and beyond many surveys of consumer behavior are likely to indicate rampant advertising skipping; measured data, rather than self-reported data paint a different picture. The television industry needs to be alert to wherever respondents may distort – deliberately or subconsciously – their response.
|
Bottom Line Even though DVRs offer the ability to avoid all television advertising, it would require two fundamental changes to viewing behavior to happen: viewers would need to pre-record absolutely everything; and they would need to keep their eyes closed while fast forwarding. Neither is likely. In an industry adept at creating live television and among a viewership that consumes an average 20 hours per week (and over 35 hours in some markets) pre-recording everything is nigh impossible. Secondly skipping through every advertisement, including the end "bumper" ad, requires a precision that most of us lack. The ad based funding model is not broken, at least by the DVR. Even if DVR users only occasionally watch pre-recorded content, this does not mean that the service is not valued or that the devices should not be subsidized. Occasional usage will engender loyalty. So if a DVR allows a viewer to watch both his or her simultaneously-broadcast favorite shows or if it means that going out does not mean missing out on the latest episode of a preferred soap opera, this is good for the broadcaster, for the program maker and for the advertiser. Indeed the television industry should constantly look at ways of making their DVRs easier to use, for example by integrating remote recording of programs with Web-based television schedules or program reviews130. The television industry should also focus on how the DVR can enable it to add value for advertisers: is it doing enough to harness data on which ads are watched, which are always fast-forwarded, and which are rewound and watched again? This data could be combined with repositories of pre-loaded advertisements stored on the DVR that could allow a degree of personalized advertising to be provided. Further, programs watched several days after first transmission could be combined with updated advertising, with a new commercial, for example, replacing an advertisement for a one-day sale. The rise of the DVR may however pose more of a threat for other parts of the entertainment sector. The ability to record with ease may well pose a threat to DVD sales and rentals. Making it easier to record films, regardless of the time they are shown, may well lessen a user's perceived need to rent or purchase a DVD. Making it easier to record television may crowd out the time available to watch any films, including those rented or purchased in DVD format. According to one survey, of DVR owners who were recording more programs than a year back, 40 percent were purchasing fewer DVDs and 38 percent were renting fewer DVDs131. |
Push Beats Pull in the Battle for the Television Viewer
Deloitte predicts that In 2011 despite the sale of tens of millions of television sets that offer a form of built-in search capability for television programming, the vast majority of viewing will be delivered on a traditional "pushed" basis, in other words the schedules will be determined by channel planners. And a growing number of selections may be pushed via recommendation engines built into the television or set top box. However the "pulling" of television content by viewers beyond the selection of a television channel is likely to remain an exceptional behavior.
Searching will be available to varying degrees of sophistication, ranging from simple search apps selectable from an on-screen menu, to powerful functionality that enables searching across a wide variety of broadcast, streamed and stored content.
Yet adoption of program searching is likely to remain modest, largely because of a lack of need. Although today's viewers may value the ability to pull content, pushed content remains their default choice. This could be attributable to the inherently passive nature of the television medium. Marshall McLuhan famously suggested in Understanding The Media that television was a "cool" medium that would require audience interactivity; however, remote control and other innovations have made TV viewers infamously inert132.
Indeed, some argue that on-demand content, delivered by any technology, may never represent the bulk of viewing for the majority of viewers. Since the time that video rental stores first gave viewers the ability to opt out of scheduled programming, picking and choosing what to watch on TV has remained for most people an occasional activity. The monetary cost of selecting à la carte is one issue: but even as prices fell for purchased or rented video cassettes (in the 90s) and DVDs (over the past decade), demand did not rise commensurately. Typically households still rent at most a few DVDs per month. The biggest barrier might be the time and attention required to select content. Having choices is wonderful, but choosing can be a chore.
Actively "pulling" content may be even less compelling in 2011 owing to growing availability of recommendation applications built into TVs and set top boxes133. Many of these applications will use previous viewing behavior to conveniently recommend new content.
Aside from the behavioral challenges involved in pulling content, price is likely to be a major obstacle in 2011. Television sets and set top boxes that incorporate the most advanced search capabilities must factor in the cost of additional processors, memory and storage, which typically add at least $50 (or 10 percent) to retail prices134. For low-end units, this additional cost will likely create a significant drag on sales. Customers pondering the selection of their next television set may well choose a larger screen rather than paying a premium for enhanced search capabilities135.
For consumers buying Internet-ready televisions that support advanced applications, a major barrier to search adoption is likely to be the required peripherals and user interface. Such televisions are likely to ship with a standard numeric keypad that makes it hard to enter search text. Upgrading to a full QWERTY keypad might be too expensive given the expected benefits, and current keyboard designs are not generally seen as elegant, convenient, or easy to use136.
When it comes to television in 2011, the only pulling that most viewers may want to do is pulling up a chair.
|
Bottom Line Technology has always played a fundamental role in television. Since the first TV broadcast, the technology has shifted from black and white to color, screen size and resolution have grown by a factor of 10, and thousands of new channels have emerged. Yet one thing has remained constant: for most people, television continues to be a passive experience. Viewers value the option to choose, but often do not exercise it. Interaction – even among those with multiple ways to control what they watch – has generally been limited to choosing channels on a remote control or, for the most sophisticated users, selecting from a DVR menu of prerecorded content. Technological progress is unlikely to shift these ingrained habits any time soon. Technology enables. But it cannot oblige. Younger generations, having grown up searching for content on computers, may bring their search habits into the living room. But this is not likely to become mass market behavior for many years. Television is – and will likely remain – more than just a piece of technology or portal to a library of content. For many households, it is a focal point for family gatherings. For many individuals, it is the principal topic of water cooler conversations with friends and colleagues. In 2011, mountains of newsprint and terabytes of online chatter will likely continue to focus on TV shows, pushing and cajoling people into what to watch. And the best search algorithm in the world is not going to change that behavior. At least not in 2011. |
Social Network Advertising: How Big Can it Get?
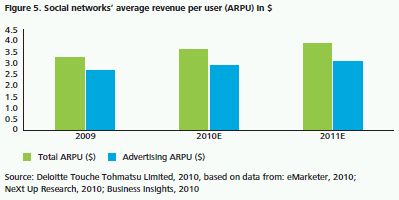
Deloitte predicts that in 2011 social networks are likely to surpass the breathtaking milestone of one billion unique members137. Also, they may deliver over 2 trillion advertisements138. Yet the advertising revenues directly attributable to social networks may remain relatively modest compared to other media, at least in the short term. With per member annual advertising revenue of about $4, that implies total 2011 advertising revenues of about $4 billion (see Figure 5). Despite social media's large and growing audience, its advertising revenues still represent less than one percent of the worldwide advertising spend total. Other sources of social network revenues, such as payments systems and e-commerce, might exhibit faster growth.
In 2011, it is likely that social networks' long-term market value will continue to polarize opinions139. Some view social networking as the technology sector's "next big thing", promising even greater rewards than the decade-old phenomenon of search advertising140. Others compare social networks to the dot com bubble and argue that monetizing their users at dollar levels similar to those of online search has not yet been demonstrated141.
Deloitte's view is that the advertising revenues from social networks in 2011 are likely to be very significant in absolute terms: total industry revenues of $4-$5 billion dollars and year-over-year growth of 30 percent are impressive numbers; individual companies may experience even higher growth rates. Yet revenue on a per-subscriber basis is unlikely to match search or traditional media in the next year or two. Also, advertising rates, measured on a cost per thousand impressions (CPM) basis142, are likely to remain low compared to other forms of online advertising as well as traditional media143.
Nevertheless, thanks to a low cost base, social networks might still achieve impressive gross margins despite their relatively low revenue per user – particularly when compared with the traditional media companies they are competing against. A social network's cost of content is close to zero since it merely provides the infrastructure, while its users and third party app developers provide all the content144.
An assessment of social networks' potential hinges on three metrics: subscriber growth, time spent on the network, and CPMs. Many social networking companies have been recording impressive gains in some of these metrics, but it is worth examining how much additional growth they can achieve.
When social networks attain the billion unique user milestone, nearly half of one global user base – computer-based Internet users – may be signed up by year-end 2011. This could put a ceiling on future growth if global Internet adoption continues to expand at the pace that consensus analysts expect145: it might be increasingly difficult for social networks to sustain their impressive subscriber growth trajectories.
Mobile data might offer a better opportunity, particularly in developing countries where mobile penetration continues to rise steadily: there are far more global mobile users than those with access to computers. However, delivering display advertising to mobile phones at volumes and prices sufficient to create a significant multi-billion dollar business may not be likely in 2011146. In 2010, mobile advertising revenues for the United Kingdom – the largest market in Europe – were only about $40 million147. As smartphones and 3G networks become more widespread, the base of active social network users should rise accordingly.
Social networks' growth trajectory is often compared with that of paid-for search, which in just 15 years grew from almost nothing into a $30 billion plus market that continues to expand. However, a decade ago broadband penetration in most countries was still in the single digits and some markets had no broadband service at all. The growth of search was at least partly fueled by significant growth in online use – a trend that social media has already capitalized on.
If social networks' advertising revenues are worth only $4 billion in 2011 with half the potential user base already signed up, or if future growth is largely restricted to the low-value mobile ad market, most of the upside for social networks would need to come from increased time spent on the network, or from improved CPM metrics.
The amount of time spent on social networks rose sharply in 2010. In fact, according to one analysis, a popular social network enjoyed a 66 percent increase between Q3 2009 and Q3 2010148. Yet even if the time spent on social networks grows by a factor of three, that might not necessarily translate into a threefold increase in advertising revenue149. Increasing inventory could cause CPMs to fall even further150.
If there are limits to audience growth and time spent, then the burden would primarily fall on CPM to drive revenue growth. Social networks' understanding of individuals' backgrounds, preferences, social groups, activities, and behaviors are without equal. There have been hopes that this would enable social networks to deliver superior advertising results: but paradoxically, social network CPMs remained among the lowest of all forms of online advertising151. That could well change, as the ability to mine the myriad data grows or as social networks may find new business models that allow for much higher advertising revenues, but for 2011 it is difficult to find the levers that would cause social network ad revenues to accelerate from their already rapid pace.
Perhaps the vastness of social networks' repository of user information is itself a limiting factor; as of 2011, it remains a challenge to economically extract useful insights from the volumes of user data that social networks generate. The billions of stated "likes" may not all necessarily signal an intent to purchase. Also, in 2011, as in previous years, privacy concerns may constrain the ability to collect the most valuable data152. Nevertheless, once social networks figure out how to rapidly and economically analyze their data, and to monetize the billions of recommendations made, a new seam of valuable customer insights will be available to mine and exploit.
|
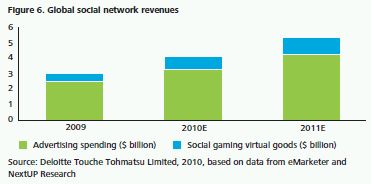
Bottom Line In 2011, the story of social networks will continue to be written with no clear conclusion in sight. Social networks remain an emerging business founded on innovation; yet they have already achieved levels of market acceptance that might have seemed inconceivable just a few years ago. The question now is whether social networks can sustain their growth trajectory and find better ways to monetize value. Even if social networks' 2011 ad revenues only meet industry forecasts, they may still have other valuable ways to generate revenue. For example, they could serve as a payment platform for the hundreds of thousands of application providers in their ecosystem. Or they could adopt a blended e-commerce department store model, where they charge for online floor space and earn a commission on any sales. Yet in 2011 these additional revenue streams, although very profitable, are unlikely to surpass advertising in importance to social networks (see Figure 6).
If low CPMs are expected to be the norm, social networks should consider how media agencies – particularly those paid by commission – are likely to respond. Agencies might conclude that commissions based on modest CPMs are less attractive than other potential clients, and could begin pushing other forms of advertising. Or they might decide to sell high value advisory services, such as public relations and reputation management, to help a brand manage its presence on social networks. Advertising firms and their clients will likely need to expand their use of social media to protect their image and reputation in a world increasingly influenced by personal opinions and grassroots communications. Studies have shown that word-of-mouth feedback and peer reviews exert tremendous influence on purchasing decisions; in fact, one survey found that up to 78 percent of people trust peer recommendations, compared to just 14 percent who trust advertisements153. Throughout 2011, it seems likely that the forecast for the social network sector will continue to be promising, but unclear. As more information is released and as business models become more developed, advertisers, competitors and analysts will get a better picture of the potential of this industry. |
To read Part 2 of Deloitte Media Predictions - 2011 click here
Footnotes
97. Sorry, There's No Way To Save The TV Business, Business Insider, 12 June 2009: http://www.businessinsider.com/henry-blodget-analysts-begin-to-realize-thattheres-no-way-to-save-television-2009-6; TiVo CEO Declares TV Almost-Dead, Wired, 20 October 2008: http://www.wired.com/epicenter/2008/10/tivo-ceo-declar/
98. Brazil, Russia, India and China.
99. PAY TV subscriber base expands in BRIC Countries while revenues grow more modestly, DatAxis Intelligence, 13 July 2010: http://www.dataxisnews.com/?p=19220
100. A growing genre of cookbooks skips recipes and focuses on science, Globe and Mail, 23 November 2010: http://www.theglobeandmail.com/life/food-andwine/a-growing-genre-of-cookbooks-skips-recipes-and-focuses-on-science/article1810272/
101. According to this article television is responsible for "a lot" of the 90 million daily tweets generated as of November 2010. Assuming that "a lot" is at least 5 million per day, this would imply over a billion tweets per year. Source: There Are 90 Million Tweets per Day, And A Lot Are TV Related, TechCrunch, 10 November 2010: http://techcrunch.com/2010/11/10/twitter-tv/. For a list of the most popular television trends topics on Twitter in 2009, see: Top Twitter Trends of 2009, Twitter Blog, 15 December 2009: http://blog.twitter.com/2009/12/top-twitter-trends-of-2009.html
102. Advertising Expenditure Forecasts, ZenithOptimedia, 6 December 2010: http://www.zenithoptimedia.com/about-us/press-releases/zenithoptimedia-adspendforecast-update-dec-2010/
103. Ibid
104. Calculation based on Nielsen data measuring time spent on Facebook in U.S., UK, Australia, Brazil for June 2009 and June 2010. Across all four countries, average time spent on Facebook was 7.5 minutes in June 2009 and 10.3 minutes a year later. Assuming a similar year-on-year increase in 2011, average time spent would be just over 14 minutes. Nielsen data provided in: The ups and downs of social networks, BBC News, 22 July 2010: http://www.bbc.co.uk/news/technology-10719042
105. This data point is based on the total population in the U.S. aged 2 or over whether or not they have the technology. Nielsen Three Screen Report, Volume 8, 1st Quarter 2010.
106. In 2009, 9 of the UK's top 50 selling books were written by individuals who had television programs, were regular guests on television shows or who had been made famous by television. Source: Review of 2009: The Bestsellers, TheBookSeller.com, 7 January 2010: http://www.thebookseller.com/in-depth/feature/108940-review-of-2009-the-bestsellers.html
107. The two leading TV magazines sell over 2 million copies between them. Five of the top 10 UK magazines are television related. Source: MAGAZINE ABCs: New editor puts Radio Times back over a million, MediaWeek, 11 February 2010: http://www.mediaweek.co.uk/news/983483/MAGAZINE-ABCs-New-editorputs-Radio-Times-back-million/; the UK X Factor magazine sells 300,000 copies per week. Source: Why the 'x factor' is A licence to print money, Independent. ie, 30 October 2010: http://www.independent.ie/entertainment/music/why-the-x-factor-is-a-licence-to-print-money-2400552.html
108. Apax on track to sell Hit Entertainment, Financial Times, 29 October 2010: http://www.ft.com/cms/s/0/6c92bd10-e2dd-11df-9735-00144feabdc0.html#axzz16Dx4O9nS
109. 'Got Talent' Kid Jackie Evancho Makes Chart Impact, Billboard, 19 August 2010: http://www.billboard.com/news/got-talent-kid-jackie-evancho-makes-chart-1004110235.story; Susan Boyle achieves transatlantic sales record, monsterandcritics.com, 17 November 2010: http://www.monstersandcritics.com/people/news/article_1599771.php/Susan-Boyle-achieves-transatlantic-sales-record
110. Strictly Come Dancing is 'world's most successful reality television format', Telegraph, 23 November 2010: http://www.telegraph.co.uk/news/worldnews/northamerica/usa/8155637/Strictly-Come-Dancing-is-worlds-most-successful-reality-television-format.html
111. For more background on the market dynamics of the Chinese television market, see: China's got viewers, The Economist, 18 November 2010: http://www.economist.com/node/17522454
112. China broadcasters strike gold with foreign formats, AFP, 23 November 2010: http://www.google.com/hostednews/afp/article/ALeqM5j5Cdo04NVSYsQwSYE3Lk-M1AnYCw?docId=CNG.9d7cb2e161ee25e135303c0ac0ee51ec.281
113. Ibid.
114. Year-on-year change at current prices, ZenithOptimedia, December 2010. For more information see: http://www.zenithoptimedia.com/about-us/press-releases/zenithoptimedia-adspend-forecast-update-dec-2010/
115. PAY TV subscriber base expands in BRIC Countries while revenues grow more modestly, DatAxis Intelligence, 13 July 2010: http://www.dataxisnews.com/?p=19220
116. At the end of Q2 2010, 40 percent of all US households had a DVR, a rise of 14 percent on the previous quarter. Source: Bigger TVs, DVR and Wi-Fi among Hot U.S. Home Technology Trends, Nielsen, 30 September 2010: http://blog.nielsen.com/nielsenwire/consumer/report-bigger-tvs-dvr-and-wi-fi-among-hot-u-s-hometechnology-trends/
117. Comment speculating on a DVR-driven end to traditional television advertising has been a constant of the last decade. Source: TV advertising's DVR challenge, CNET News, 23 May 2006: http://news.cnet.com/2100-1024_3-6075233.html; for a view from 2005, which estimated 50 percent of viewing would be skipped by 2010, see: Sky+ won't kill TV ads, says media buyer, Guardian, 28 November 2005: http://www.guardian.co.uk/media/2005/nov/28/advertising.broadcasting1
118. One survey of marketers found that 75 percent would cut their television ad budget as a result of ad-skipping technology. Forrester report from February, 2002 cited in: The TiVo Effect: Advertisers See Less TV Ad Spending, ClickZ, 25 November 2002: http://www.clickz.com/clickz/news/1704616/the-tivo-effectadvertisers-see-less-tv-ad-spending
119. One consumer survey in 2002, found that 72 percent of DVR users skip commercials. Source: Will TiVo revolutionize television viewing?, CNN, 5 December 2002: http://edition.cnn.com/2002/SHOWBIZ/12/04/hln.connect.tivo/
120. CEA Finds American Adults Spend $1,200 Annually on Consumer Electronics Products, Consumer Electronics Association, 26 April 2007: http://www.ce.org/Press/CurrentNews/press_release_detail.asp?id=11274
121. Bush 160GB Top Up TV Digital TV Recorder, Amazon: http://www.amazon.co.uk/Bush-160GB-Top-Digital-Recorder/dp/B002H9G5Z6/ref=sr_1_3?s= electronics&ie=UTF8&qid=1289717850&sr=1-3
122. Duke study: TiVo doesn't hurt TV advertising, Triangle Business Journal, 3 May 2010: http://www.bizjournals.com/triangle/stories/2010/05/03/daily6.html
123. According to Twitter, "a lot" of the tens of millions of daily tweets are about television shows. Source: Twitter Plus TV Creates "Social Viewing", GigaOM, 10 November 2010: http://gigaom.com/2010/11/10/twitter-plus-tv-creates-social-viewing/
124. For an example of a smart phone application designed to foster commentary about television programs, see: tvChatter iPhone Application from frog design Uses Twitter to Make TV Social, Frog design press release, 16 October 2009: http://www.frogdesign.com/press-release/frog-design-hosts-unique-digital-think-inwith-npr-10072009.html
125. Why DVR Viewers Recall Some TV Spots, Wall Street Journal, 26 February 2008: http://online.wsj.com/public/article/SB120398730105292237.html?mod=blog; Also see: DVR Fast-Forwarding May Not be Fatal to TV Ads, PRNewswire, 3 November 2008: http://www.prnewswire.com/news-releases/dvr-fast-forwardingmay-not-be-fatal-to-tv-ads-65213522.html
126. Study: TiVo, other DVRs don't negatively affect TV advertising, CrunchGear, 4 May 2010: http://www.crunchgear.com/2010/05/04/study-tivo-other-dvrs-dontnegatively-affect-tv-advertising/
127. Programmes that have had this uplift in the UK include True Blood and Glee. Source: PVR pumps up the numbers, Broadcast, 18 March 2010: http://www.broadcastnow.co.uk/ratings/pvr-pumps-up-the-numbers/5011886.article?query=0
128. For example, in Canada, while 86 percent of DVR owners pre-record content, only 3 percent of all viewing is actually of pre-recorded content. Canadians watch about 30 hours per week on average. Source: One in five Canadians own a PVR, Digital Home, 13 August 2010: http://www.digitalhome.ca/2010/08/one-infive-canadians-own-a-pvr/
129. On TV: perspectives on television in words and numbers, Deloitte LLP UK, August 2010: http://www.deloitte.com/view/en_GB/uk/industries/tmt/mediaindustry/81fdbc5df883a210VgnVCM200000bb42f00aRCRD.htm
130. For example see: SundayTimes.co.uk's paying readers can set Sky TV recordings, Guardian, 27 April 2010: http://www.guardian.co.uk/media/pda/2010/apr/27/times-sky or see this video: TiVo Premiere app for iPad, http://www.youtube.com/watch?v=IQ82HW81t9o
131. Deloitte LLP UK/YouGov, July 2010: sample, 567 DVR owners who were recording more on their DVR than a year back.
132. Marshall McLuhan Theses on "The Television": http://www.utoronto.ca/mcluhan/mcluhanprojekt/fernsehen2.htm
133. This functionality is now available via the BBC's iPlayer, see: http://iplayerhelp.external.bbc.co.uk/help/using_bbc_iplayer/friends_feature
134. Google TV reviewed: Did Google get ahead of itself?, Crosscut.com, 8 November 2010: http://crosscut.com/2010/11/08/technology/20319/Google-TV-reviewed:-Did-Google-get-ahead-of-itself-/
135. See this article for details of price reductions on some deep-search equipment: Struggling Google TV Devices Have Prices Slashed at Retail, Gizmodo, 28 November 2010: http://gizmodo.com/5700535/struggling-google-tv-devices-have-prices-slashed-at-retail
136. Sony Google TV Remote Leaked, Designed in 1980?, Wired, 6 October 2010: http://www.wired.com/gadgetlab/2010/10/sony-google-tv-remote-leakeddesigned- in-1980/ 137. Deloitte estimate based on data from Strategy Analytics: Social Networks Set to Conquer Asia, 18 October 2010: http://blogs.strategyanalytics.com/dcp/555/ and also considering data from: The Social Networking Marketing Opportunity, Business Insights, April 2010, referenced in eMarketer.
138. In Q3 2010, Facebook served 297 billion ads in the U.S. and 68 billion in the UK. Source: Facebook Is Dominating The Display Ad Market, Business Insider, 8 November 2010: http://www.businessinsider.com/chart-of-the-day-online-ad-impressions-2010-11; Facebook Grabs Huge Portion of Display Ad Market for Q3, Daily Tech, 9 November 2010: http://www.dailytech.com/Facebook+Grabs+Huge+Portion+of+Display+Ad+Market+for+Q3/article20105c.htm; UK online display ads up 34pc – comScore, Business & Leadership, 4 November 2010: http://www.businessandleadership.com/marketing/item/26504-uk-online-display-ads-up/
139. For a view from 2008, see: MySpace and Friends Need to Make Money. And Fast., Wired, 24 March 2008: http://www.wired.com/techbiz/it/magazine/16- 04/bz_socialnetworks; for a view from 2009, see: MySpace's Revenue Problems, GigaOM, 6 February 2009: http://gigaom.com/2009/02/06/myspaces-revenueproblems/; for a view from 2010, see: Facebook's $100 Billion Valuation Doesn't Sound Stupid Anymore, All Facebook, 22 April 2010: http://www.allfacebook.com/facebooks-100-billion-valuation-doesnt-sound-stupid-anymore-2010-04
140. One forecast from 2006 estimated mobile social network revenues alone would be worth $52 billion by 2012. Some commentators value Facebook at $100 billion. One view of social network valuations as of June 2008 attributed a value of between $3.3 and $19.9 billion to MySpace, and between $2.5 billion and $15 billion to Facebook. A sale of B market shares in Facebook in August 2010 implied a valuation of $33.7 billion. Twitter has been valued at up to $4 billion. Source: Mobile Social Networking Revenues Could Reach US$52 Billion by 2012, Cellular-news, 11 February 2008: http://www.cellular-news.com/story/29233.php; Facebook's $100 Billion Valuation Doesn't Sound Stupid Anymore, All Facebook, 22 April 2010: http://www.allfacebook.com/facebooks-100-billion-valuation-doesnt-sound-stupid-anymore-2010-04; Could Facebook be Worth $100 Billion by 2015?, DailyFinance.com, 3 April 2010: http://www.dailyfinance.com/story/company-news/could-facebook-be-worth-100-billion-by-2015/19383338/; Modeling The Real Market Value Of Social Networks, TechCrunch, 23 June 2008: http://techcrunch.com/2008/06/23/modeling-the-real-market-value-of-social-networks/; Facebook's 'value' soars as investors seek pre-IPO stake, Financial Times, 24 August 2010: http://www.ft.com/cms/s/0/054fc0ee-afa7-11df-b45b-00144feabdc0.html; Bidding War for Twitter Raises Valuation to Nearly $4 Billion. Kleiner Perkins Currently In Pole Position, TechCrunch, 30 November 2010: http://techcrunch.com/2010/11/30/bidding-war-for-twitter-raises-valuation-to-nearly-4-billion-kleiner-perkins-currently-in-pole-position/
141. Look upon MySpace, Facebook, and despair, Financial Times, 4 November 2010: http://blogs.ft.com/gapperblog/2010/11/look-upon-myspace-facebook-and-despair/
142. CPM refers to "cost per mille", which is the cost to the advertiser per thousand impressions. CPM is a common charging metric used in advertising.
143. Valuing Facebook's Ads, Wall Street Journal, 11 November 2010: http://online.wsj.com/article/SB10001424052748703665904575600482851430358.html?mod=googlenews_wsj; Social Networks Sink Online-Ad Pricing, Adage, 12 July 2010: http://adage.com/digital/article?article_id=144884; Social Networking, Financial Times, 28 July 2010: http://www.ft.com/cms/s/3/d3e24a92-9a50-11df-8346-00144feab49a.html
144. Twitter's 2009 costs have been estimated at $25 million. Source: Twitter Starts Selling Advertising to Boost Revenue, Business Week, 13 April 2010: http://www.businessweek.com/news/2010-04-13/twitter-starts-selling-advertising-to-boost-revenue-update1-.html
145. In 2010, the number of Internet users passed 2 billion: Source: The World in 2010, ITU Report: http://www.itu.int/ITU-D/ict/material/FactsFigures2010.pdf
146. Forrester forecasts US mobile display advertising revenue at $1.26 billion in 2015. Forrester report dated 27 October 2010, cited in an article titled 'Mobile search and display ad spending to hit $816 million this year' from Internet Retailer, 10 November 2010: http://www.internetretailer.com/2010/11/10/2010-mobile-search-and-display-ad-spending-hit-816-million and http://www.forrester.com/rb/Research/us_mobile_search_and_display_forecast%2C_2010/q/id/57645/t/2?src=RSS_2&cm_mmc=Forrester-_-RSS-_-Document-_-4
147. UK mobile advertising revenues top £27.47 million in 2010, Internet Retailing, 9 September 2010: http://www.internetretailing.net/2010/09/uk-mobileadvertising-revenues-top-27-47-million-in-2010/
148. In February 2009, according to comScore data, the average European Facebook user spent 3 hours per month on the site. Source: Fast-Growing Facebook #1 in Most of Europe, comScore data referenced in Marketing Charts, 15 April 2009: http://www.marketingcharts.com/interactive/fast-growing-facebook-tops-in-mostof-europe-8725/comscore-facebook-time-spent-europe-minutes-february-2009jpg/
149. In Q3 2010, Facebook was estimated to serve up 24 percent of all ad impressions on the Web among U.S. users, but generate only 10 percent of the revenue. Source: Facebook Gets 24% Of All Display Ad Impressions, But Only 10% Of All Display Ad Dollars, Business Insider, 11 November 2010: http://www.businessinsider.com/facebook-gets-24-of-all-display-ad-impressions-but-only-10-of-all-display-ad-dollars-2010-11
150. Social Networks Sink Online-Ad Pricing, Adage, 12 July 2010: http://adage.com/digital/article?article_id=144884
151. comScore: Social media stifling CPM rates, NewMediaAge, 13 July 2010: http://www.nma.co.uk/news/comscore-social-media-stifling-cpm-rates/3015741.article
152. Google and Facebook face new privacy code, Guardian, 3 November 2010: http://www.guardian.co.uk/technology/2010/nov/03/google-facebook-new-privacy-code; NHS Link to Facebook Raises Privacy Concerns, PCWorld, 25 November 2010: http://www.pcworld.com/businesscenter/article/211711/nhs_link_to_facebook_raises_privacy_concerns.html
153. A video on 'The Growth of Social Media', Mashable: http://www.mashable.com/2010/05/07/social-media-stats-video/
The content of this article is intended to provide a general guide to the subject matter. Specialist advice should be sought about your specific circumstances.