The table below sets out the most common fees and charges directly charged to the Client and the range possible.
Table 3: The most common fees and charges – directly charged to the Client

The broker is paid by the insurance company, note that the Client does pay the brokers commission, indirectly. In fact he may pay a premium of up to an additional 20% to cover the insurance companys' risk of paying the broker up-front.
Table 4: The Brokers commissions
![]()
The table below begins the cost analysis setting out the main fees and charges in setting up and maintaining a life insurance structure as a percentage of paid in premium over the first 5 years. This is necessary as a one year analysis is meaningless, 10 years would be better. When damage is done, most of it tends to happen over the first 5 years. The broker and insurer up front charges are taken over the first five years. The asset manager, if he is going to, will build up the proportion of funds with high up-front charges and management fees in the first five years.
Table 5: The main costs in setting up and maintaining a life insurance structure over 5 years

The extraordinary range of fees prevalent and the effect on return is obvious, the problem again for the Client is transparency. Regarding the bottom line, the table below sets out the total cost in both percentage and absolute terms for a policy with the following assumptions:
- € 1,000,000 premium paid in on inception
- 6% p.a. raw return on the underlying assets
- "Balanced" Strategy. I.e., 40% equity, 40% bonds, 20% Alternative and other.
Table 6: Total fees charged to Client over 5 years as percentage of paid in premium and absolute value

The broker is paid by the insurance company, so is indirect. The broker is however the source of the cost, presented below.
Table 7: Brokers commissions
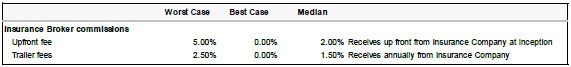
The "median" is what we estimate as "standard practice" in the industry. It is not possible to calculate a weighted average as there are no reliable figures available. We estimate the "median" values as the most appropriate on the basis of experience and accepted "normal practice" for the industry1.
"Worst case" can get rather nasty, with charges apparently exceeding even what is presented here. Whereas "best case"; on large policies can easily get better than what is presented here. For example, one provider we know has no establishment fee and charges a 0.25% administration fee. This admittedly is on policies of over €5 Mio. We are most concerned here with policies between €500K and €5 Mio.
The next step is to look at the effect on return, the table below takes the parameters in the table above and calculates the effect on net return over 5 years, assuming a 6% p.a. return on the underlying investments2.
Table 8: Portfolio return over 5 years

A median total return of around 10% – 15%% gross over 5 years equates to ca. 2.3% p.a. CAGR remaining of the 6% p.a. "raw" return. This is the crux of the problem, too often, the Client is paying too much for the service provided. If we assume inflation to be around 1.5% p.a., the Client is left with less than 1% on his nominal 6% "raw" return.
We believe that the above analysis is representative of the industry, with a cartoonish wide range possible: -10% to +23% return over the first 5 years. We believe both worst and best cases do happen and for otherwise identical policies from the same insurer. The party with the most power to influence portfolio return is the asset manager. The asset manager:
- Decides the management fee
- Influences transaction costs and depot fees
- Decides which investment funds and/or structured products to put into the portfolio
-
- At which price and whether to take up front loads on how much of the portfolio
If the range appears to stretch credulity, bear in mind that ca. 80% of independent asset managers in Switzerland take retrocessions as a part of their revenue models3 - retrocessions amount to between a third and a half of total revenues of the industry as a whole depending on whose statistics you believe.
Table 9: Further explanation of some of the key assumptions

The cost structure of PPLI is intransparent, variable, complex and often misrepresented. Determining the true cost has been extraordinarily difficult, arguably due to industry interest in keeping it that way plus the lack of reliable statistics. While the insurance company is usually transparent, an asset manager determined to be evasive can make it practically impossible to determine the true cost of a unit linked life insurance policy. The insurance companies are for the most part silent on the cost issue, quite reasonably so as it is the Clients' wish to have the assets managed by the manager of his choice. The Client therefore bears the risk.
Insurance can be cheap and efficient, a policy can cost:
- 1 - 2% of total premium to set up and 1 - 1.5% p.a. to maintain4
The identical policy can be very expensive, in extreme cases:
- 9 - 10% or more of premium over 5 years to set up and 3 - 4% p.a. to maintain
An insurance policy, poorly set up, can cost upwards of 40% of invested capital over the first five years. The Client does not perceive it in this way, the upfront fees are partially hidden, being deducted over a period of 5 years. The issue is often transparency, in all too many cases, there is all too little. Disclosure to the end Client is often the minimum required by law, which in Switzerland and Liechtenstein is not a lot. This can lulls investors into a false sense of security. Strict disclosure requirements serve to inform investors, assuming they or their advisors read the information. The insurance companies, as large, government regulated institutions generally disclose their fees well. All other participants involved – from the broker to the fund companies - generally have zero incentive to disclose information on fees and charges. The issue is the many layers of fees, charges and deductions, each with varying degrees of transparency to the Client, with participants having a large degree of discretion to vary those charges. There are fees that the Client sees and is directly informed about, e.g., depot charges, there are those that he is "half-aware" of, i.e., that these fees exist, but the level and effect are not made clear, e.g., trailer fees to broker and asset manager, performance fees, etc. Then fees that are hidden, non-disclosed and occasionally denied that have a direct effect on investment performance, e.g., Retrocessions and kickbacks on brokerage and the purchase of investment funds. These charges in particular destroy a large part of investor return on the underlying assets over time. We now look at each participant in detail.
Footnotes
1 The median values being what we see as the values separating the upper half of values from the lower half.
2 For simplicity we have used simple interest addition, no compounding.
3 Source: Swiss Banking Institute of the University of Zürich
4 For policies in the €500K to €1 Mio. range this is representative. For policies over €5 Mio, the insurance company can waive the establishment fee leaving a reasonable low end estimate of around 0.5% for the asset manager to set up. Plus a combined 1-1.5% p.a. for both asset manager and insurer to maintain.
The content of this article is intended to provide a general guide to the subject matter. Specialist advice should be sought about your specific circumstances.