
Summary
Decarbonizing the U.S. energy system will require a program of building onshore wind, offshore wind, utility-scale solar, and associated transmission that will exceed what has been done before in the United States by many times, every year out to 2050. These facilities, together with rooftop photovoltaics and other distributed generation, are required to replace most fossil fuel generation and to help furnish the added electricity that will be needed as many uses currently employing fossil fuels (especially passenger transportation and space and water heating) are electrified. This Article, excerpted from Michael B. Gerrard & John Dernbach, eds., Legal Pathways to Deep Decarbonization in the United States (ELI Press forthcoming 2018), discusses the four most important legal processes and obstacles involved in this enormous project: site acquisition and approval; the National Environmental Policy Act; state and local approvals; and species protection laws. It also presents recommendations for lowering the obstacles and briefly discusses several corollary actions that are needed.
Introduction
Achieving the Deep Decarbonization Pathways Project (DDPP) scenarios1 to decarbonize the U.S. energy system will require a program of building onshore wind, offshore wind, utility-scale solar,2 and associated transmission that is not only unprecedented—it will exceed what has been done before in the United States by many times, every year out to 2050.
This Article will discuss the four most important legal processes and obstacles involved in this enormous project: site acquisition and approval; the National Environmental Policy Act (NEPA); state and local approvals; and species protection laws. It will also present recommendations for lowering the obstacles, and it will briefly discuss several corollary actions that are also needed.
These problems are not unique to the United States. A 2016 study from the International Energy Agency found that large renewable projects in France, Norway, and the United Kingdom have also been plagued in varying degrees by delays from political/regulatory issues, site access, environmental approvals, and grid connection.3
Approval delays are costly in several ways. Construction costs may escalate. New technologies or requirements may compel a revision in designs, leading to further delays. Applicants may become so discouraged by the delays that they give up, or their financing may vanish, or local opposition to siting may grow. Lenders who require speedy returns may be deterred from engaging at all. During the years that a renewable facility is not yet operating, the energy needs it will fill may be provided by fossil fuel facilities that add to the cumulative load of greenhouse gases.
After quantifying the number of facilities needed, this Article discusses each of the four principal processes in turn. First, however, it is appropriate to introduce NEPA,4 since it is so pervasive in what follows. NEPA requires federal agencies to prepare an environmental impact statement (EIS) for any major federal action significantly affecting the quality of the human environment. Utility-scale projects on federal land, or offshore, almost invariably require an EIS. The NEPA process can go on for several years and cost millions of dollars, and it often leads to litigation that can take still more years.
As discussed below, recent legal and administrative reforms have shown promise in shortening NEPA time lines and reducing litigation for renewable energy projects, but the field remains challenging. Several related actions may be considered together in a "programmatic" EIS, sometimes (but not always) followed by narrower site-specific EIS or environmental assessments; this "tiering" process has the potential to reduce duplicated effort.5
It must also be noted that the Donald Trump Administration is moving to rescind a large number of environmental regulations and guidance documents, especially those adopted during the Barack Obama Administration. The Trump Administration is clearly very favorable toward fossil fuel development; its attitudes toward renewable energy development remain to be seen. Readers are cautioned to ensure that any federal regulations or orders referenced here are still in effect.
II. The Massive Number of Needed Facilities
The DDPP scenarios all call for the construction of a massive number of new central station renewable energy facilities, mostly wind and solar—many times higher than the amount of such construction ever previously achieved. These are required to replace most fossil fuel generation and to help furnish the added electricity that will be needed as many uses currently employing fossil fuels (especially passenger transportation and space and water heating) are electrified. (Some of this needed capacity could be met instead by small-scale distributed units, mostly rooftop solar photovoltaic (PV) and solar thermal.) All of this is in addition to aggressive programs of energy efficiency and, possibly, expanded use of nuclear energy and hydropower.
The amount of energy produced in the United States from wind and solar sources has been rapidly increasing, as shown in Table 1.
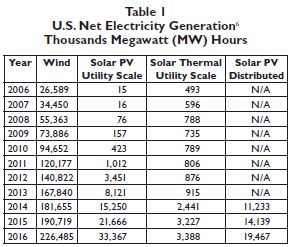
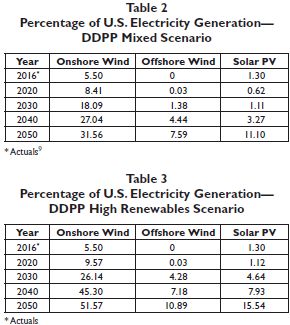
In 2016, wind and solar amounted to 6.9% of U.S. electricity generation.7 By 2050, this will need to go up to 50.25% under the DDPP Mixed Scenario and 78.0% under the DDPP High Renewables Scenario, as shown in Tables 2 and 3.8
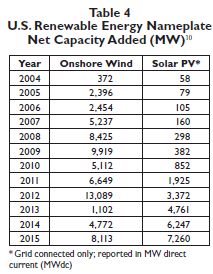
Tables 1, 2, and 3 show electricity generation—the electricity that is actually generated. The amount of new generating capacity added each year—the amount of electricity that could be generated if the units were running all the time—has fluctuated considerably for wind (not solar), due mostly to the expiration and renewal cycles for federal tax credits. This is shown in Table 4.
The amounts of new generation capacity added each year under the DDPP Mixed Scenario and DDPP High Renewables Scenario are presented in Tables 5 and 6.11 As these tables show, the amount of new capacity that will need to be added each year must be many times higher than what has been achieved in prior years.
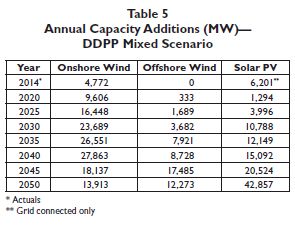
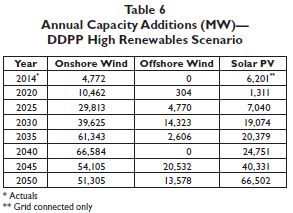
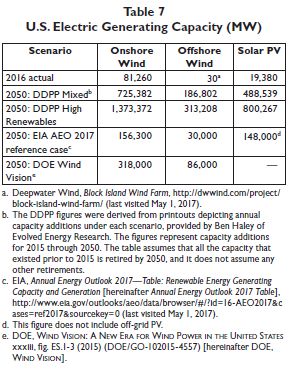
Table 7 compares the electric generating capacity from wind and solar PV that actually existed in 2016 to what is projected for 2050 under the DDPP Mixed and High Renewables Scenarios; the Energy Information Administration's (EIA's) 2017 Annual Energy Outlook (AEO) reference case (which assumes that the statutes and regulations of 2016 remain in place, that known technologies will improve, and that economic and demographic trends continue); and the U.S. Department of Energy's (DOE's) Wind Vision report. The table starkly shows the order of magnitude-scale increases that will be needed over current capacity, and the large increases needed beyond DOE's projections for 2050.
To view the full article click here
Author's Note: The author thanks the following reviewers for their comments on earlier drafts: David Cleaves, John Dernbach, David Hayes, Michael Hindus, Ryan Jones, Yael Lifshitz, Ethan Shenkman, Eleanor Stein, and Edward Strohbehn.
Footnotes
1. The Deep Decarbonization Pathways Project is a global consortium of researchers working on practical methods to deeply reduce greenhouse gas emissions in their own countries. See http://deepdecarbonization.org/.
2. Utility-scale facilities are typically stand-alone and are designed to provide power to the electric grid. They are in contrast to distributed facilities, which are often attached to buildings and are designed to help power those buildings and perhaps the immediate community, though they sometimes sell excess power to the grid.
3. International Energy Agency's Implementing Agreement for Renewable Energy Technology Deployment, Final Report: Documenting the Cost of Regulatory Delays (Re-Delays) (2016), available at http://iea-retd.org/wp-content/uploads/2016/03/RE-DELAYSfinal- http://iea-retd.org/wp-content/uploads/2016/03/RE-DELAYSfinal- report.pdf.
4. 42 U.S.C. §§4321 et seq.
5.40 C.F.R. §1508.28. This was successfully done by the Bureau of Land Management (BLM) in the Dry Lake, Nevada, solar energy zone. Because of the programmatic EIS for the zone, three large projects were able to move forward in less than 10 months under tiered environmental assessments. Press Release, U.S. Department of the Interior, Interior Department Approves First Solar Energy Zone Projects (Apr. 26, 2016), available at https://www.doi.gov/ pressreleases/interior-department-approves-first-solar-energy-zone-projects.
6.U.S. Energy Information Administration (EIA), Electric Power Monthly With Data for February 2017 tbls. 1.1 and 1.1.A (2007) [hereinafter Electric Power Monthly], available at https://www.eia.gov/ electricity/monthly/pdf/epm.pdf.
7.Id.
8.Source: Personal Communication with Ben Haley, DDPP (Aug. 29, 2016).
9.Source of actuals: Electric Power Monthly, supra note 6, tbls. 1.1 and 1.1.A. Excluded is the very small amount of electricity generated by the Rhode Island offshore wind facility that opened on Dec. 12, 2016.
10. U.S. Department of Energy, National Renewable Energy Laboratory, 2015 Renewable Energy Data Book 22 (2016), available at http://www. nrel.gov/docs/fy17osti/66591.pdf.
11. Source: Personal Communication with Ben Haley, DDPP (Aug. 26, 2016).
The content of this article is intended to provide a general guide to the subject matter. Specialist advice should be sought about your specific circumstances.
