
NERA has developed a proprietary database of fines and other enforcement activity by the Financial Services Authority (FSA), covering the period from 1 April 2002 to 31 March 2012 (fiscal years 2002/03 to 2011/12). We use these data to analyse in depth the FSA's recent enforcement activities and how they compare with its stated priorities. We have classified fines by the type of underlying alleged misconduct, the type of firm, and the influence level of the individuals fined.2 Our analysis reveals underlying trends not necessarily visible from review of individual cases.
Last year, the FSA made headlines with several record-breaking fines against firms; in the most recent financial year, it imposed fines of unprecedented size on individuals: the £19.8 million in financial penalties assessed in 2011/12 is more than twice the 2010/11 level and exceeds the combined amount levied on individuals in all prior years since 2002/03, the first year for which data are available (see Figure 1).

Overall, the FSA imposed £10 million less in fines in 2011/12 compared with the prior year, but this difference is less than the single largest record-breaking fine in 2010/11 against JP Morgan. Excluding the very largest fines (those in the all-time top 10 for firms or the all-time top 10 for individuals) the aggregate of fines for firms and individuals rose nearly 20 per cent in 2011/12 (see Figure 2).

Our other key findings include:
- Consistent with the FSA's declared intention of concentrating its enforcement activities on high-profile individuals, the fines imposed on the directors and executives of large companies have increased in both number and magnitude over the past two years.
- Recent increases in penalties have occurred in advance of the widespread official implementation of the FSA's revised penalty framework. The increasing focus on high-profile individuals and the effect of the revised framework may further increase fine amounts.
- The number of fines imposed on individuals in 2011/12 approached the record level for 2010/11 after accounting for the eight cases that were referred to the Upper Tribunal. The number of fines imposed on firms reverted to a level close to the average observed during the "light-touch" era of 2002/03 to 2007/08.
- The mix of fines against individuals shifted in 2011/12 as compared to the prior three years, with fewer fines for Insider Dealing, but more fines for Market Manipulation and Failure to Prevent Misconduct. The most noteworthy shift in the mix of fines against firms was the near-absence of fines for Compliance Failures: there was only one such fine in 2011/12, as compared to 13 over the prior two years.
- The amount of top 10 fines levied against individuals in 2011/12 was more than four times higher than in the prior year (see Figure 3). In contrast, the amount of top 10 fines against firms declined in 2011/12 (see Figure 4). However, the median fine against individuals and firms both rose to record levels.
- The number of individuals criminally indicted by the FSA fell in 2011/12 as compared to the prior two years. These criminal sanctions have primarily been for Insider Dealing cases and the number of civil fines for Insider Dealing also fell in the past year.
- Increasingly, enforcement actions are being contested in the Upper Tribunal. The Tribunal held five hearings in cases involving contested fines in 2011/12. Eight additional Decision Notices were published for which Tribunal decisions have not yet been rendered.
- Not withstanding being overturned in the Pottage case, the FSA has been quietly successful in other similar cases over the last three years, fining individuals in compliance and supervisory roles for failing to prevent misconduct committed by others.
- The transfer of enforcement responsibility to the Financial Conduct Authority (FCA) is likely to reinforce certain trends already underway, such as a more proactive approach to retail financial products enforcement and public disclosure of enforcement actions before the publication of a Final Notice.


Background: The Role of Financial Penalties in Enforcement
According to the FSA's Decision Procedure and Penalties Manual (DEPP), the principal purpose of imposing a financial penalty is:
"to promote high standards of regulatory and/or market conduct by deterring persons who have committed breaches from committing further breaches, helping to deter other persons from committing similar breaches, and demonstrating generally the benefits of compliant behaviour" (DEPP 6.1.2G).
This paper focuses primarily on FSA fines, which comprise any amount ordered to be disgorged, and any additional penalty. We also examine trends in Upper Tribunal appeals and criminal prosecutions. Our analysis is based primarily on the information contained in the Final Notices published by the FSA upon resolution of civil enforcement actions.3
A description of the range of disciplinary, criminal, and civil powers to sanction firms and individuals whose conduct fails to meet required standards or violates the law is provided in our prior paper.4 That paper also includes a flowchart depicting the criminal, civil, and regulatory enforcement options available to the FSA and the alternative steps the parties may choose to take in resolving each type of action.
Background: Recent Developments in Enforcement Policy
Our analysis of FSA fines provides a basis to assess how enforcement outcomes measure up to stated objectives and policy. To provide context for this assessment we begin by reviewing recent developments in FSA enforcement policy.
Since 2008/09, the FSA has pursued a stated objective of using fines, prohibition, and criminal prosecution to achieve "credible deterrence." In 2010, the FSA revised its DEPP governing the determination of penalties ("revised penalty framework"). The FSA described the reasons for the revision in its 2009 consultation paper: to be more transparent; to aid consistency; and to increase the level of penalties. According to Margaret Cole, former director of enforcement at the FSA, credible deterrence means "making people realise that they can suffer meaningful consequences if they break the law and if they don't improve their standards of behaviour."5 This change in policy shifted the focus of enforcement onto individuals,6 and the volume of cases against individuals rose accordingly. In this context, priorities recently highlighted by the FSA have included protecting retail investors, holding high-level managers and directors accountable for misconduct within firms, combating bribery and corruption, and targeting market abuse.
Protection of retail investors: The FSA has recently established a practice of publishing an annual Retail Conduct Risk Outlook (RCRO) outlining risks to consumers in the financial services sector. In the most recent RCRO, published in March 2012, the FSA highlighted the risk that consumers are being sold unsuitable financial products.7 The FSA's initiatives to protect retail investors include the Retail Distribution Review (RDR), a comprehensive reform designed to encourage transparency in the fees charged for investment advice and to set higher standards for investment advisors' qualifications. The RDR is set to be adopted in January 2013.8 In addition, an expansion of enforcement powers to intervene in the development and marketing of financial products to retail investors, including the power to approve and pre-emptively ban or restrict the sale of certain products, is planned.9 These expansive powers of product intervention are expected to be given to the FCA when it inherits the FSA's enforcement responsibilities next year.
In April, the FSA proposed an industry-wide consumer redress scheme for the first time, exercising powers updated in 2010 under the Financial Services and Markets Act (Section 404).10 The completion of the consultation process and a final decision on any disciplinary action may establish important precedents for future enforcement action in cases of mis-selling. The scheme proposed by the FSA would provide compensation to investors who were mis-sold CF Arch Cru investment funds, requiring the almost 800 firms that sold the funds to review their past business and pay redress as appropriate.11 This scheme would be in addition to the voluntary scheme agreed to by the authorised corporate director of the funds and its depository institutions. However, in this case no penalty was imposed.
Under the FSA's revised penalty regime, penalties in such cases are determined as a percentage of relevant revenue. We discuss below the potential for the revised penalty regime to increase the level of fines in cases involving unsuitable investment advice or mis-selling.
Focus on High-Profile individuals: Recently, the FSA has focussed particular attention on enforcement actions alleging market abuse by prominent individuals. For example, as we reported in our previous paper, Tracey McDermott, the acting FSA head of enforcement, stated, "We recognise the need to go after bigger fry, not because they're wealthy or high profile—we want to go after the people we actually think are causing the most damage to the market."12
The FSA has also stressed holding key individuals responsible for failures in the oversight or management of large financial institutions. For example, this issue was highlighted in the December 2011 report on the FSA's investigation into the failure of the Royal Bank of Scotland (RBS). The Chairman of the FSA, Adair Turner, opined that "errors of judgement and execution made by RBS executive management" led to RBS's demise, but noted that, under existing rules, no individual was found legally responsible.13 To address this, Turner suggested two policy changes: introducing "strict liability" for banks' management, senior executives, and boards in the event of failure, and adopting an "incentives-based approach" that could entail banning officers and directors from future positions of responsibility, or ensuring that a significant proportion of their pay would be forfeited should a bank fail.14 While it remains to be seen whether major policy changes will be implemented, the FSA has announced record fines against individuals and has imposed an increasing number of fines against senior management for failure to prevent misconduct, as we report below.
Combating bribery and corruption: While the FSA does not enforce the Bribery Act 2010, it has prioritised supervision and enforcement in relation to firms' anti-bribery and corruption (ABC) systems and controls.15 The FSA has recently undertaken a thematic review into ABC systems and controls in investment banks.
Targeting market abuse: The FSA continues to focus on insider dealing and market manipulation, including spot checks by its Transaction Monitoring Unit with a greater emphasis on systems and controls.16 The FSA continues to bring criminal charges in its strongest and most serious insider dealing cases.
NERA's Fines Database and Classification Scheme
NERA has compiled a database of FSA enforcement actions involving fines, with which to track and analyse trends in enforcement activity. The database contains all enforcement actions that have resulted in fines announced since 1 April 2002.17
We have classified each fine according to the principal type of underlying misconduct alleged.18 This classification departs in certain respects from the presentation of enforcement activity by the FSA in its annual reports, which is organised largely in terms of regulatory objectives and principles such as systems and controls, treating customers fairly, unauthorised activities, and market protection, etc.19 Our conduct-based classification system reveals the types of activity sanctioned most frequently and fined most heavily, no matter under which principle or rule sanctions were imposed. This provides an objective and empirical view of the types of conduct subject to FSA enforcement. The number of fines in each of our 13 conduct-based categories is depicted in Figure 5.
Our classification scheme first makes a distinction between cases alleging violations of market integrity—i.e., behaviour that distorts or otherwise negatively affects financial markets—and other types of cases. Our Market Integrity violation category is slightly more expansive than the concept of "market abuse" specifically authorised under the Financial Services and Markets Act in that it includes cases alleging the failure of firms or individuals to disclose information they were obligated to disclose in accordance with the Listing Rules.20

Alleged misconduct that does not directly affect securities markets is included in one of three categories: Customer Protection Failures, Compliance Failures, or Other Fraud or Misconduct. Customer Protection Failures consist of: Mishandling Client Assets; Unsuitable Investments & Mis-selling; Mistreatment of Customers; and Inadequate Security & Safeguards. Compliance Failures consist of: Transaction Reporting, Record-Keeping & Pricing Failures; Approved Person Regulation Failures; Failure to Prevent Misconduct; and Miscellaneous Regulatory Failures, such as failure to comply with FSA rules and requests. The Other Fraud or Misconduct category encompasses deliberate deceptive conduct not classified elsewhere, such as falsifying mortgage applications. These categories of fines are defined in detail in the Appendix.
The relative frequencies of fines over the past three fiscal years in each of our categories of alleged misconduct are depicted side-by-side for firms and individuals in Figure 5. Criminal indictments are also reported in the relevant categories.21
Classifying High-Profile Individuals
We define "High-Profile" individuals as directors and executives of major institutions, including Significant Influence Function Holders of regulated financial institutions22 as well as managers of non-financial firms. Major institutions are defined as banks (based on the FSA's definition),23 hedge funds (if referred to as such by the FSA), major private equity firms,24 and other firms with at least £50 million in annual revenue.25 Individuals not employed by a firm or whose alleged misconduct was unrelated to their employment are listed separately (to date, these are all private individual investors).
Characteristics of Recent Enforcement Actions Involving Fines
The mix of cases against individuals and firms differs, with relatively more fines against individuals in Market Integrity cases, and fines against firms focused on Customer Protection and Compliance Failures, especially by banks. Some categories account for many fines, but a small fraction of the aggregate value of fines. Conversely, other categories account for relatively few fines but a larger fraction of the aggregate value. In some cases, the greater than pro rata share of aggregate value is due to a few very large fines.
Fines Against Individuals
Recent fines against individuals have related to a range of alleged misconduct with no single dominant category. The two categories with the largest number of fines from 2009/10 to 2011/12 were Mortgage Fraud and Unsuitable Investments & Mis-selling, with 19 fines each (see Figure 6). However, these cases account for less than 10 per cent of the aggregate amount of fines. Market Integrity fines together represent about two-thirds of aggregate fine amounts. The two largest categories in terms of fine value were Insider Dealing and Market Manipulation. This reflects the fact that Market Integrity-related fines are larger, on average, than other types of fines against individuals.
 F
F
One factor contributing to higher fines against individuals in Market Integrity cases is the FSA's practice of basing penalty amounts for market abuse on the benefit enjoyed by the individual as a result of the misconduct, i.e., the illicit profit gained or the loss avoided.26 By contrast, non-market abuse fines to date appear to have been largely based on subjective assessments and recent precedent. In the absence of an empirical basis for the level of fines for Customer Protection and Compliance Failures, the FSA has often imposed somewhat arbitrary punitive amounts of £20,000 or £25,000 (before discounts for cooperation) in smaller cases.27 The illicit profits and avoided losses that provide the basis for penalties in Market Integrity cases usually exceed this level, resulting in higher penalties. Moreover, the revised penalty framework sets a minimum penalty in serious cases of market abuse of £100,000, about four times the typical penalty for Customer Protection and Compliance Failures.
Going forward, under the revised penalty regime, penalties for non-market abuse violations by individuals will be based on the value of individuals' benefits from employment, with penalties up to 40 per cent of these amounts. Assuming hypothetical annual compensation of £400,000, a level 3 violation (with level 5 being most serious and level 1 least serious) would correspond to a penalty of £80,000 (20 per cent of compensation). For executives with higher compensation and in cases involving more serious violations, penalties would be even higher. The median fine against executives and directors over the last few years for Customer Protection and Compliance Failures was £17,500. In future, then, penalties in non-market abuse cases could rise substantially as compared to recent levels in comparable cases.
Fines against individuals include very few against employees of banks (see Figure 7). The most common targets of fines against individuals are employees working outside the banking sector at small firms. But in terms of the aggregate value of fines, employees of investment funds and private investors are more heavily penalised than individuals in any other category.

Fines Against Firms
In contrast to its enforcement activities against individuals, the FSA rarely fines firms for Market Integrity violations (see Figure 8). However, Customer Protection Failures represent close to two-thirds of both the number and aggregate value of fines.28 The categories of misconduct with the largest number of fines against firms were Unsuitable Investments & Mis-selling cases, of which there were 25 fines over the past three financial years, and Mistreatment of Customers & Mishandling of Complaints, with 11 fines. In dramatic contrast to the mix of fines against individuals, fines for Market Integrity violations represent a tiny fraction of enforcement activity against firms. The category with the largest aggregate fine amount was Mishandling Client Assets (£47.2 million); however, this is largely explained by a single £33.3 million fine against JP Morgan in 2010/11, the largest imposed by the FSA to date.

Top 10 FSA Fines to Date against Individuals and Firms
Several fines against individuals announced since the beginning of fiscal year 2011/12 were larger than any previously imposed by the FSA. Six of the top 10 penalties to date against individuals were assessed since the beginning of fiscal year 2011/12, as compared with two during the prior 12 months. These include four of the top five fines to date, the largest of which was for more than £6 million. One of the top 10 fines against individuals has already been announced since the end of the 2011/12 fiscal year (see Figure 9).

Of the recent top 10 fines against individuals, three were brought against High-Profile individuals at major hedge funds or private equity firms. Only one was imposed on an employee of a bank. All but three of the top 10 fines against individuals were for market abuse: either Market Manipulation or Insider Dealing (see Figure 9). Had Alberto Micalizzi, CEO and a director of Dynamic Decisions Capital Management Ltd, not contested a £3 million penalty for misrepresenting the value of assets held by a fund managed by the company, the top 10 fines against individuals would include another recent fine. If the FSA prevails, the fine will be the third highest assessed against an individual and the largest ever in a non-market abuse case.
By contrast, the frequency of very large fines against firms has been more consistent in recent years. The FSA imposed penalties large enough to be included in the top 10 fines against firms twice in the most recent year, the same frequency as in 2009/10 but once less than in 2010/11. It has become routine to see fines against major financial institutions in the £2 million to £7 million range each year.29
The two top 10 fines against firms added in 2011/12 rank fifth and sixth on the list, leaving last year's two record fines against JP Morgan and Goldman at the top (see Figure 10). Only two top 10 fines against firms have been for Market Integrity violations. However, had Swift Trade not contested a Decision Notice, 2011/12 would also have included a fine for Market Manipulation in excess of £6 million.30 This case is still pending before the Upper Tribunal. Top 10 fines in non-Market Integrity cases were mainly imposed on banks for a variety of misconduct falling into our Customer Protection Failure and Compliance Failure categories.
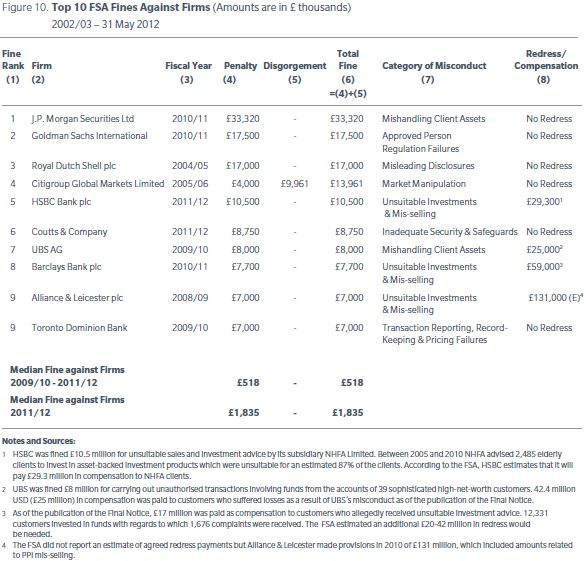
Three of the top 10 fines against firms were for Unsuitable Investments & Mis-selling to retail customers; in each of these cases millions of pounds were also paid in redress. Another fine that was accompanied by large redress payments was assessed in 2009/10, for Mishandling Client Assets in connection with unauthorised transactions on behalf of 39 high net-worth customers of UBS. These fines, all imposed over the past four years, ranged in size from £7 million to £10.5 million and involved estimates of redress reported by the FSA ranging from £25 million to £59 million. In addition, although the FSA did not report an estimate of agreed redress payments in the case of Alliance & Leicester's £7 million fine for Payment Protection Insurance (PPI) mis-selling, the company made provisions in 2010 of £131 million, which included amounts related to PPI mis-selling.31
None of these fines was decided under the revised penalty framework (discussed further below), under which penalties can be multiples of the harm or potential harm estimated to have been caused by the misconduct.32 Had penalties in these cases even equalled the amount paid in redress, they would have been at least three times larger than they actually were. This suggests significant scope for increases in the level of fines in the future, as the new penalty framework is more frequently applied.
Trends in the number and mix of cases
Fines against Individuals
The number of fines against individuals in 2011/12 did not reach the prior year's high of 50 cases, but the 39 fines imposed in 2011/12 exceeded the number of fines in any other year. As seen in Figure 11, the decline was principally in the number of fines for Market Integrity violations, which fell from 17 to 12 (largely the result of fewer fines for Insider Dealing), and Customer Protection Failures which fell from 13 to nine. The 12 fines imposed for Market Integrity violations included several very large fines for Market Manipulation. The drop in the number of cases in 2011/12 might be explained in part by the increasing number of cases appealed to the Upper Tribunal (discussed further below). The eight fines against individuals referred to the Tribunal almost make up for the shortfall of 11 as compared to 2010/11.33 Another potential explanation is a shift in enforcement resources into a smaller number of "complex, labour-intensive and multi-jurisdictional cases" rather than a greater number of more straightforward cases.34

Even though the number of individual fines fell in 2011/12, the average size of fines increased considerably, so that aggregate fines rose. As seen in Figure 12, fines for Market Integrity violations nearly trebled, while fines in non-Market Integrity cases increased by almost 50 per cent, even after unprecedented increases the prior year. The median fine for individuals now equals £100,000, the minimum penalty for serious market abuse under the revised penalty framework.35 For Market Integrity violations, the average fine for individuals now stands at £1.3 million, almost seven times the average of £200,000 for non-Market Integrity cases.

Fines against Firms
The number of fines against firms in 2011/12 fell back close to the average level seen during the so-called "light-touch" era prior to 2008/09 (see Figure 13), though the number of fines against firms was also at about this level in 2009/10. At the same time, the average fine amount against firms reached a record high (see Figure 4). In aggregate, the £58.7 million in fines imposed in 2011/12 was higher than in any year other than 2010/11 (when the record level of aggregate fines was largely a consequence of two unprecedented fines, against JP Morgan and Goldman Sachs). The adoption of the FSA's credible deterrence regime in fiscal year 2008/09 can be seen in Figures 13 and 14 to be coincident with an increase in the size of fines against firms for non-Market Integrity violations since 2008/09.
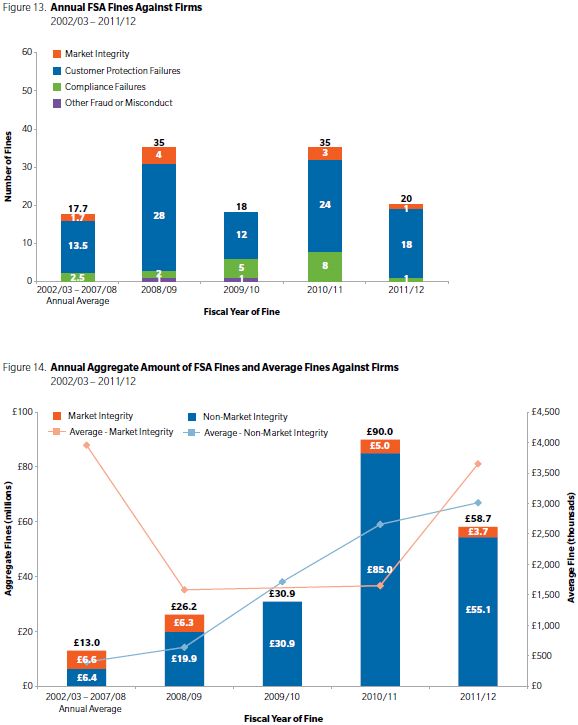
For Market Integrity violations, the average fine imposed on firms in 2011/12 was £3.7 million, not much higher than the £2.9 million average for other violations. Comparing fines imposed on firms and individuals in Market Integrity and non-Market Integrity cases reveals an interesting contrast: in cases alleging Insider Dealing or Market Manipulation, the most common Market Integrity violations, the average fine against firms in 2011/12 was only about three times as large as that against individuals, while for non-Market Integrity violations, the average fine against firms was approximately 16 times as large.
The underlying increase in the value of fines against firms is seen more clearly after separating out the contributions of: the somewhat idiosyncratic incidence of very large fines; the variation in the annual number of claims; and the mix of claims involving different types of misconduct. As depicted in Figure 15, after removing top 10 fines, the aggregate amount of remaining fines in 2011/12 is £39.5 million, almost 80 per cent higher than the average calculated the same way over the prior three years. There were fewer fines against firms in 2011/12 than in the previous three years, and there were no fines for Transaction Reporting, Record-Keeping & Pricing Failures, which have tended to result in larger than average fines. Based on the reduction in number of fines36 and the shift in the mix of cases,37 aggregate fines excluding the top 10 cases would be expected to have fallen to below £10 million in 2011/12. Instead, as noted, this figure stood at nearly £40 million, as a result of increases in the fine amounts within individual categories of fines, a 300 per cent increase overall.38

One particular source of increases in fines has been cases involving Customer Protection failures related to Unsuitable Investments & Mis-selling, typically to retail customers. There were 10 fines imposed against firms for such violations in 2011/12, only two more than in the prior year, but the aggregate amount of these fines, £29 million, was more than three times the prior year's level (see Figure 16). These included a £10.5 million fine against HSBC for mis-selling by one of its subsidiaries of asset-backed investment products to elderly customers.

Enforcement against High-Profile Individuals and Major Institutions
Last year we noted an apparent paucity of fines against High-Profile individuals:
[F]ew cases have been brought against senior managers at financial sector institutions. Recent publicity regarding the successful prosecution of hedge fund Galleon Group co-founder Raj Rajaratnam in the US may have put pressure on the FSA to act against insider dealing by high-profile financial professionals, not just the "small fry." It remains to be seen whether the FSA—and, later, the FCA— will further step up and/or refocus enforcement efforts related to insider dealing as a result.
As discussed above, we have formulated and applied a definition of "High-Profile individuals" as directors and executives of major institutions. This allows us to assess whether the FSA has stepped up enforcement action against such individuals. We find that in 2011/12, the FSA's fines against High-Profile individuals increased to a record level. Even though the number of fines against individuals overall dropped in 2011/12, the number of cases against High-Profile individuals rose in each of the last two years. Furthermore, three of the 10 fines in 2011/12 against High-Profile individuals were ranked in the top five individual fines to date.
The majority of fines against individuals were imposed on directors and executives of smaller firms (see Figure 17); however, the average fine in these cases is relatively low, so these fines formed only a small proportion of aggregate fine amounts (see Figure 18). The 10 cases in 2011/12 against High-Profile individuals constituted almost half the total amount of fines against individuals over the last year. Just three fines against private investors contributed almost £8 million of the nearly £20 million total. But 2011/12 would be a record year for individual fines even absent the private investor fines.

The average fine against High-Profile individuals in the last two years has been higher than the average for fines against other employees (see Figure 19). In 2011/12, such fines were about five times higher. But whether fines against High-Profile individuals were higher because of some characteristic these cases tend to have, rather than simply because of the prominence of the individuals involved, is not evident from a simple comparison of annual averages. High-Profile cases more often involve Market Integrity violations and so fines could be higher simply because Market Integrity fines tend to be higher. We use multivariate regression analysis to disentangle the relative importance of each of these characteristics in explaining the variation in the size of penalties over time. We analyse penalties to remove the effect of disgorgement since amounts ordered disgorged by the FSA are a component of fines in some cases. We then characterise the cases in terms of the type of misconduct, the year of the fine, the employment status of individuals, the size of their employers, and whether the fine included a disgorgement component.40

This analysis shows that penalties in cases against High-Profile individuals are higher even after accounting for these other factors and the influence of very large penalties on the average values.41 The average amount of penalties has risen in recent years not just because of a change in the mix of cases. This analysis also verifies the earlier observation from the comparison of simple averages, that cases involving certain types of alleged misconduct, for example Market Manipulation cases, are associated with higher penalties. These effects are reported in Figure 20 and are measured relative to the penalties involving allegations of Unsuitable Investments & Mis-selling by employees other than directors or executives of small firms during the period 2002/03 to 2007/08.42 Figure 20 also reports the corresponding effects on fines against firms. Thus, for example Figure 20 shows that penalties against individuals for Insider Dealing tend to be between 30 and 35 times the level of penalties associated with Unsuitable Investments & Mis-selling.

Our test of the effect of cooperation by individuals on net penalties is weakly supportive of the proposition that penalties after purported discounts are indeed lower than penalties in similar cases without discounts.43 The average amount of the stated discounts given for cooperation is between 20 per cent and 30 per cent, an amount not statistically different from the 35 per cent measured in the regression. This test cannot be performed for fines against firms because almost every firm cooperates and so there is an insufficient number of cases with which to measure the effects relative to contested cases.
Fines for Failure to Prevent Misconduct
In its recent decision in the John Pottage case, the Upper Tribunal rejected the FSA's proposed fine for inadequate supervision. This has focused attention on the FSA's stated goal of holding managers to account for failing to detect misconduct or to have adequate systems or procedures in place to prevent misconduct. Although the Tribunal decided against the FSA in this case, the FSA has been quietly successful in other similar cases against individuals over the last three years. The FSA also fines firms for failures in systems and controls that could have deterred or prevented individual misconduct in cases in which firms were not held responsible for the underlying misconduct. For example, in 2003, ABN Amro was fined for, amongst other things, failing "to allocate adequate resources to compliance policies and procedures to enable its compliance functions to be carried out effectively and kept up-to-date", issues similar to those for which the FSA attempted to sanction Pottage. While the Pottage case echoes the concern about out-dated compliance policies and procedures, in 2003 the FSA fined the firm whereas in 2011 it pursued a senior executive.
Since the beginning of 2009/10 it has become more common for the FSA to fine individuals in compliance and supervisory roles that put them in a position to have potentially prevented misconduct committed by others. For example, in the Pace Financial Management Case in 2009/10, three separate individuals were fined for failing to prevent the firm being used to facilitate mortgage fraud.44 Among the reasons for the fines was the alleged failure to ensure that systems and controls, which were in place with regards to file checking, were applied appropriately.
Most recently, on 18 November 2011, Dr Sandradee Joseph was fined £14,000 for failing in her role as a compliance officer. According to the FSA, Dr Joseph failed to properly investigate and act on information she received regarding the suspicious purchase and resale of a bond. According to the FSA, she relied wrongly on misinformation from the rogue employee responsible for the trades and on her belief that the firm's outside lawyers would have acted if necessary. The bond was a fraudulent instrument and the employee who arranged its purchase and resale had done so to conceal losses suffered by funds managed by her firm.
The increase in the number of individuals being held responsible for failures to prevent misconduct is evident in Figure 21. In light of this trend, it seems unlikely that the Pottage decision will reduce the risk of individuals facing FSA enforcement for supervisory and control failures.

Size of Fines in Relation to Amount of Illicit Benefit
The revised framework, which applies to conduct on or after 6 March 2010,45 prescribes penalties that increase with the seriousness of misconduct based on a multiple of up to four times the amount of illicit financial benefit resulting from the breach of regulations, up to 20 per cent of relevant revenue (for firms), or up to 40 per cent of annual benefits of employment associated with the subject activities (for individuals). For serious cases of market abuse, the DEPP also prescribes a minimum fine of £100,000.46 Under aggravating circumstances the FSA may further raise its penalty through an uplift of up to 100 per cent. This means that, before any discount for early settlement, a penalty prescribed under the DEPP in serious cases at four times the financial benefit of the misconduct could be doubled to eight times the benefit.
To date, the FSA has imposed fines under the revised penalty framework in only four cases.47 However, the relationship between penalties and the reported financial benefits of misconduct in past cases reveals that penalties were based in part on the amount of illicit benefits even prior to the DEPP revisions coming into force.
The relationship between the amount of penalties and the financial benefit derived from misconduct is depicted in Figure 22. We plot penalties imposed on individuals and firms against the illicit profits or losses avoided by defendants in cases in which the FSA ordered disgorgement, or in market abuse cases in which the financial benefits of misconduct were reported. Figure 22 includes only cases in which penalties are larger than £100,000 and relate to financial benefit of more than £10,000.48 It shows that, in most cases, penalties at least match the amount of financial benefit. The FSA requires illicit profits to be disgorged; thus, in such cases the total fine including disgorgement equals at least twice the direct financial benefit.

In market abuse cases that predate the revisions to the DEPP, penalties have not always been set within the new standard range of one to four times the illicit benefit or loss avoided.49 For example, the FSA imposed a penalty of £175,000 (before a discount for cooperation) against one individual in an Insider Dealing case (Jeremy Burley), equal to approximately eight times the financial benefit. We note that had the penalty been set at four times the financial benefit it would have fallen below the new £100,000 minimum for market abuse codified in the revised DEPP.
Turning to fines against firms, in two cases shown in Figure 22, penalties were significantly greater than four times the financial benefit. The penalty imposed on Evolution Beeson Gregory would have been £400,000 rather than the actual penalty before early settlement discount of £500,000 if set at four times the benefit. The penalty against GLG Partners would have been £368,000 rather than the actual amount of £750,000. This may reveal that, even prior to the adoption of the revised penalty framework, the FSA adjusted some penalties upward for increased deterrent effect.
Two penalties against individuals and one against a firm in Figure 22 are below the level of financial benefit associated with the misconduct (appearing on the bottom-right portion of the graph). In the Maslen case, the FSA stated that the penalty was lower than it would otherwise have been because Maslen forfeited bonus income of £1.83 million. However, even including the amount of his forfeited bonus, the penalty was less than the financial benefit from the Market Manipulation for which he was fined. The FSA may have imposed a lesser penalty because Maslen did not benefit directly from the market abuse. The absence of a direct benefit to Andrew Osborne in the Greenlight case may also have lowered his penalty, which was less than half the financial benefit earned by his colleague David Einhorn.
The £4 million penalty imposed on Citigroup in June 2005 is another exceptional case. This penalty represents less than half the direct financial benefit that the FSA calculated was earned by Citigroup in connection with the Eurozone government bond trading strategy at issue.50 The FSA did not, however, fine Citigroup for market abuse and so appears to have treated this case as a technical violation (in general terms: "failing to conduct its business with due skill, care and diligence") rather than market manipulation.
Had the FSA based the penalty on the amount of financial benefit, it would be surprising for the penalty in this a case to be less than £7 million, the amount of the financial benefit less a 30 per cent discount. However, under the revised guidelines, a penalty would ordinarily be based on a percentage between zero and 20 of relevant revenue. In the trade in question, Citigroup sold bonds and futures contracts with a combined nominal value of €12.9 billion (approximately £8.5 billion if converted using the exchange rate that prevailed on the date of the trade) on which it made $18.2 million (£10.0 million) in profits. A penalty of £10 million before an early settlement discount would have amounted to only 0.1 per cent of the nominal value of the relevant trades, well below the lowest level suggested under the revised DEPP of 5 per cent.
In cases of market abuse, the revised penalty framework references benefits to others as a basis for an individual's penalty only when the individual has been instrumental in achieving the benefit.51 Consequently, it is silent on whether to take into account incidental benefits to others resulting from the market abuse by a firm (such as in the GLG Partners case). The Upper Tribunal has identified this as a concern, questioning whether it is appropriate for the FSA's penalty in the Michiel Visser case to be computed as:
"a multiple of the profit made or loss avoided by the individual for his own benefit, or for the benefit of other individuals where the individual has been instrumental in achieving that benefit, as a direct result of the market abuse."52
Three cases involving fund sponsors illustrate a seeming inconsistency on this question. The penalty imposed on Greenlight Funds was based on a multiple of that hedge fund's £650,000 illicit profit from higher performance and management fees, rather than the £5.8 million total loss avoided by the investors of Greenlight Funds collectively. However, the GLG Market Neutral Fund made a substantial profit from the alleged market abuse, reportedly in the region of $500,000 (approximately £310,000), compared with the $92,000 (approximately £57,000) GLG Partners' profit.53 In this case, the GLG Partners' penalty of £750,000 represents more than eight times its illicit profits. From the Final Notice, it appears the penalty was based on the illicit profit of the Fund. Finally, in the case of the Mercurius International Fund set up by Michiel Visser, his penalty was £2 million whilst the NAV enhancement to his own investment achieved through Market Manipulation was £2.65 million. The €35 million (£26 million) losses of the other investors were not taken into account in the FSA's determination of Visser's penalty.
To read this article in its entirety please click here.
Footnotes
1 Mr Hinton is a Vice President and Mr Patton is a Senior Consultant at NERA. The authors would like to thank Zachary Slabotsky, Caroline Wu, and William Cole for research assistance and Vinita Juneja for helpful comments on previous drafts.
2 The paper is also featured on our financial regulatory enforcement trends website, www.EnforcementTrends.com.
3 The FSA also publishes data on other sanctions and disciplinary enforcement activity in its annual report and performance account. However, these data were not available for 2011/12 sufficiently in advance of publication to be incorporated into our analyses.
4 Paul Hinton and Robert Patton, "Trends in Regulatory Enforcement in UK Financial Markets, Fiscal Year 2010/11", NERA Economic Consulting working paper, July 2011.
5 Margaret Cole (2009), "Delivering Credible Deterrence", Speech at the FSA Annual Financial Crime Conference, 27 April 2009, available from http://www.fsa.gov.uk/library/communication/speeches/2009/0427_mc.shtml.
6 Margaret Cole (2009), "How Enforcement Makes a Difference", Speech at the FSA Enforcement Law Conference, 18 June 2008, available from http://www.fsa.gov.uk/library/communication/speeches/2008/0618_mc.shtml; FSA (2010), "Enforcement financial penalties", Policy Statement 10/4, paragraph 3.10, page 14, available from http://www.fsa.gov.uk/pubs/policy/ps10_04.pdf.
7 See http://www.fsa.gov.uk/static/pubs/other/rcro12.pdf.
8 See "RDR Consumer Guide: Changes to the way you get financial advice", 5 April 2012 (http://www.fsa.gov.uk/static/pubs/consumer_info/rdr-consumer-guide.pdf); and "Getting ready for the Retail Distribution Review (RDR)", Speech by Linda Woodall, Head of Investments Department, FSA at the FT Intermediary Forum, London, 17 April 2012 (http://www.fsa.gov.uk/library/communication/speeches/2012/0417-lw.shtml).
9 See FS11/3, "Product intervention" (http://www.fsa.gov.uk/pubs/discussion/fs11_03.pdf); "FCA statement of policy – making temporary product intervention rules", paragraph 1.24, p 5, available from http://www.fsa.gov.uk/static/pubs/other/draft-statement-policy-temporary-pi-rules.pdf.
10 "FSA launches redress scheme consultation for Arch cru investors," FSA/PN/044/2012, 30 April 2012.
11 Paul McMillan, "Arch cru fallout highlights FSCS broken model", Money Marketing, 4 May 2012, www.moneymarketing.co.uk.
12 Bloomberg, "U.K. FSA Targeting London's 'Bigger Fry' in Insider- Trade Probes", 12 May 2011.
13 "FSA Board publishes report into the failure of the Royal Bank of Scotland"12 December 2011, full report at http://www.fsa.gov.uk/library/communication/pr/2011/110.shtml.
14 Ibid.
15 See, e.g., "The FSA and the Bribery Act", Financial Crime Newsletter, September 2011 (http://www.fsa.gov.uk/pubs/newsletters/fc_newsletter15.pdf), p. 3.
16 See "FSA prepares crackdown on market abuse", The Financial News, 30 Apr 2012. http://www.efinancialnews.com/story/2012-04-30/fsa-crackdown-market-abuse?mod=rss-assetmanagement.
17 1 April 2002 is the date from which fines data are published on the FSA fines table. This date corresponds to the beginning of the first complete fiscal year during which the FSA exercised its full responsibilities under the Financial Services and Markets Act 2000. The fines table is available at http://www.fsa.gov.uk/pages/about/media/facts/fines/index.shtml.
18 Our classifications rely on the descriptions in the FSA fines table and in Final Notices. In cases involving multiple types of misconduct, the FSA's characterisation of the principal offense in the case was used to classify the fine, except that cases involving market integrity violations are always classified within the relevant market integrity category.
19 See, e.g., the FSA's Enforcement Annual Performance Account 2010/11, Data and analysis, p.11.
20 The FSA has codified market abuse in the Code of Market Conduct, as consisting of insider dealing, market manipulation, and certain misleading disclosures. Failure to disclose, by contrast, is a breach of Listing Rules but not of the Code of Market Conduct, and is therefore not officially classified as market abuse. However, the FSA often describes failures to disclose as having distorted ("created a false market for") a company's securities. In terms of the equivalent economic effects of misconduct, it makes sense to treat failures to disclose as violations of Market Integrity. We classify cases as violations of Market Integrity where accounting or other misstatements were made, and the FSA expresses concern about the effect of the misstatements on the market for publicly traded securities, even when the misstatements were not a breach of the Code of Market Conduct (i.e., are not legally considered market abuse). As a result, the cases we classify as involving alleged misleading disclosures include three fines over the last three years that the FSA does not classify as involving market abuse.
21 Anjam Ahmad is the only individual who has been subject to both a fine and a criminal indictment. Ahmad was fined for accepting gifts in return for giving preferential treatment to a broker; in our classification this fine is classed as Other Fraud or Misconduct. The FSA also indicted Ahmad for Insider Dealing to which he pleaded guilty.
22 The FSA regulates the financial services market, including, but not limited to: banks and building societies; investment firms; credit unions; mortgage and other home finance providers and brokers; insurers and insurance brokers; and stockbrokers, asset managers, and financial advisers.
23 See http://www.fsa.gov.uk/library/other_publications/banks.
24 Firms were identified as private equity if referred to as such by the FSA or if listed on the 2012 PEI 300 listing the World's 300 largest private equity firms: www.peimedia.com/Pages.aspx?pageID=3391.
25 The classification of High-Profile individuals is not very sensitive to changing the revenue threshold for financial services firms.
26 Data for a sample of cases involving disgorgement of illicit benefits or loss avoided are discussed below and presented in Figure 22.
27 Since the beginning of the 2008/09 fiscal year, a quarter of fines for Customer Protection and Compliance Failures included penalties of £20,000 or less (before early settlement discounts) and almost half the penalties were less than £50,000 (before early settlement discounts).
28 As noted above, Customer Protection Failures encompass Mishandling Client Assets, Unsuitable Investments & Mis-selling, Mistreatment of Customers & Handling of Complaints, and Inadequate Security & Safeguards.
29 In each year since 2008/09 there has been at least one fine of at least £7 million levied against a firm.
30 Decision Notice, "7722656 Canada Inc formerly carrying on business as Swift Trade Inc", 6 May 2011, published by the FSA, available from http://www.fsa.gov.uk/static/pubs/decisions/swift_trade.pdf. 31 Santander UK plc, 2010 Annual Report on Form 20-F, www.santander.co.uk.
32 DEPP 6.5.
33 There are eight published Decision Notices imposing fines for which there are not yet published Tribunal Decisions.
34 According to Angela Hayes, a partner at Mayer Brown, "Behind the scenes the FSA has been putting significant resources into complex, labor-intensive, and multi-jurisdictional cases." Brooke Masters and Maria Tadeo, "City watchdog targets big names," Financial Times, 3 January 2012.
35 DEPP 6. 5C.2, paragraphs (2)(c) and (3)(c), "The five steps for penalties imposed on individuals in market abuse cases", available from http://fsahandbook.info/FSA/html/handbook/DEPP/6/5C.
36 The effect of the decrease in the number of fines outside the top 10 is calculated as the reduction in the number of fines outside the top 10 in 2011/12 valued at the overall average fine amount for 2008/09-2010/11, excluding the top 10 fines.
37 The effect of the change in the mix of fines outside the top 10 is calculated by comparing the 2008/09-2010/11 level of fines, adjusted for the reduction in the number of fines in 2011/12, with what the total fines would have been in 2011/12 assuming that the average fine amounts within each category matched the 2008/09- 2010/11 levels. There were no fines imposed on firms for Insider Dealing in the 2008/09-2010/11 period to use as a benchmark, so fines in this category are assumed to equal the average value of Insider Dealing fines in 2011/12 adjusted for the effect of increases in the size of fines (see note 38).
38 The change in the size of fines of the same type, outside the top 10, is calculated by comparing the actual 2011/12 fines with what the total fines would have been in 2011/12 given the number of fines in that year, but assuming that the average fine amounts within each category matched the 2008/09-2010/11 levels. There were no fines imposed on firms for Insider Dealing in the 2008/09-2010/11 period to use as a benchmark, so fines in this category were assumed to have increased at the same overall average rate as fines in other categories (specifically, the average increase in fines calculated by weighting by the number of fines across categories in 2011/12).
39 Paul Hinton and Robert Patton, "Trends in Enforcement in UK Financial Markets, Financial Year End 2011", NERA Economic Consulting, July 2011.
40 We explain variation in the log of penalties which helps normalise the distribution, improving the estimation and at the same time making the results less sensitive to the limited number of very large penalties. This regression analysis does not include an objective measure of the magnitude of harm or potential harm resulting from the misconduct. Further coding of the fines may allow such analysis in the future and could alter the estimated effects of other factors in the regression.
41 Penalties are expressed in natural logarithms. This means that the percentage effect of explanatory variables on the size of very large penalties is given approximately equal weight to the same percentage effect on small penalties. In this way, we limit the influence of very large penalties, which would otherwise dominate the results.
42 Note that choosing a benchmark group of cases with relatively low penalty values means that relative effects of various factors are expressed as multiples of these low benchmark levels. Had 2011/12 market manipulation cases been used as a benchmark, the same relative effects would have been reported as fractions of benchmark levels.
43 This result is statistically significant at the 90 per cent confidence level.
44 FSA (2010), "FSA fines three partners at Sheffield mortgage broker for systems and controls failures", available from http://www.fsa.gov.uk/library/communication/pr/2010/114.shtml; Final Notices, "Paul Andrew Armitage", "Huw Merfyn Evans" and "Brian Smith", 18 March 2010, published by the FSA, available from http://www.fsa.gov.uk/library/communication/pr/2010/114.shtml.
45 "Enforcement financial penalties", Policy Statement 10/4, available from http://www.fsa.gov.uk/pubs/policy/ps10_04.pdf.
46 DEPP 6.5A-6.5C.
47 These four cases are summarised in Figure 23.
48 In many cases involving serious misconduct by individuals prior to March 2010 (mainly mortgage fraud cases), £100,000 penalties were imposed even when the improper financial benefit disgorged was much less. Figure 22 does not include any cases involving redress.
49 Figure 22 reports the amount of penalties before discounts for cooperation.
50 Assuming that the penalty incorporated an implicit 30 per cent discount for "very good cooperation during the course of the investigation," the pre-discount penalty would have amounted to 57 per cent of the financial benefit.
51 DEPP 6.5C.2(3)(a).
52 Whilst upholding the penalty imposed by the FSA, which was based only on Visser's gain, the Upper Tribunal nonetheless opined, "It cannot be irrelevant that other investors lost €35 million, in part because they were deliberately misled, while Mr Visser salvaged his own investment before it was too late, even though the penalty is intended to punish rather than to be used as a substitute for restitution...". (Visser and Fagbulu v FSA (2011), Upper Tribunal judgement, line 6, paragraph 120, p 32, available from http://www.tribunals.gov.uk/financeandtax/Documents/decisions/VisserandFagbulu_v_FSA.pdf.)
The content of this article is intended to provide a general guide to the subject matter. Specialist advice should be sought about your specific circumstances.
